【Agile FAQ No. 10】Velocity Is Not Stable. Can We Use It for Planning?
Back to Top
To reach a broader audience, this article has been translated from Japanese.
You can find the original version here.
Thank you for reading this article. I am Tomohiro Fujii, a member of the Agile Group.
In No. 9, I discussed producing a range-based outlook from actual velocity rather than converting points into person-days. I also wrote that the problem with conversion tables is that they fix moving actual results into a single number. I took a detour into the logic of estimation in the special edition, but this time, continuing from No. 9, I will discuss velocity itself—the foundation beneath it. And the same problem of “fixing” something appears here in a different form.
Question
#Our velocity varies from sprint to sprint: 20 → 35 → 18. We use the average for the next sprint plan, but it often misses the mark, and some team members are saying, “Shouldn’t we avoid relying on velocity until it becomes stable?” Should we wait for it to stabilize?
Answer
#People who raise this concern usually have the following three concerns at the same time.
- Is it because our team is still immature that our velocity varies?
- How many sprints do we need to wait before it becomes stable?
- Is it okay to use fluctuating numbers for planning?
Let us look at them in order. Variation does not occur because the team is immature. It is normal for a team’s velocity to vary during its first few months. The estimation baseline, team coordination, and PBI granularity are all still developing. No matter how many sprints you wait, one number that “does not fluctuate” will never arrive. And you can use it for planning while it still varies. The problem is not the variation itself, but trying to handle something that varies using a single average value. Use a range rather than an average. Simply changing how you say it to “our velocity is 18–35” turns velocity into a planning tool. However, a range does not become reliable until you have accumulated about five sprints of actual results; until then, it is a period for focusing on recording data (discussed in more detail in the prescription section).
If I were to narrow it down to two key points: “read variation as information” and “do not make stabilization the goal.”
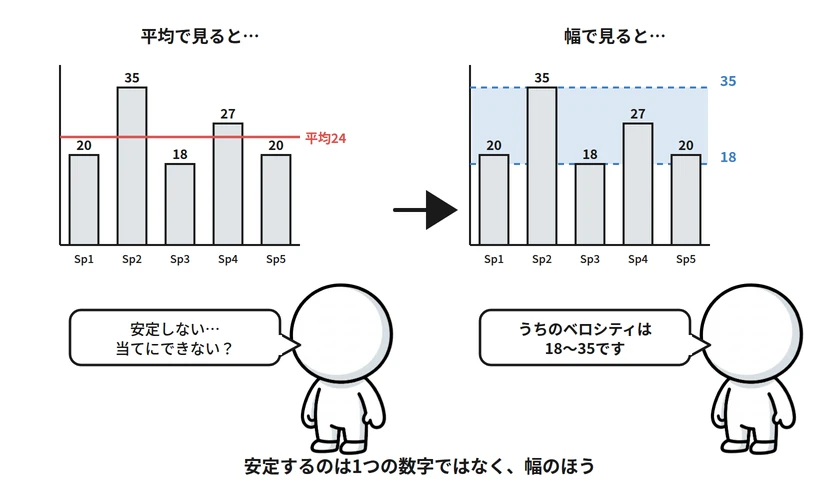
Did You Believe the Teaching That “Velocity Will Stabilize”?
#I believe many of you have been taught in training sessions or books that “velocity stabilizes after several sprints” and “stable velocity forms the basis of planning.” At the time, did you have questions like these?
- Ours has not stabilized even after half a year. Is something wrong?
- Since vacations, incidents, and interruptions differ every time, would it not be stranger for it to stabilize?
- How should we explain something that does not stabilize to our manager?
I had the same questions when I was on the receiving end of training. To give the answer first, this is a misunderstanding of what “stabilize” means. What stabilizes is not a single number, but the range. It is true that the reasons for variation differ each time, which is precisely why you retain it as a range. And you can explain it to management as a range. However, stopping here would leave this as merely a slogan. Let us first look at how velocity tends to be handled, then consider it properly.
Velocity Anti-Patterns
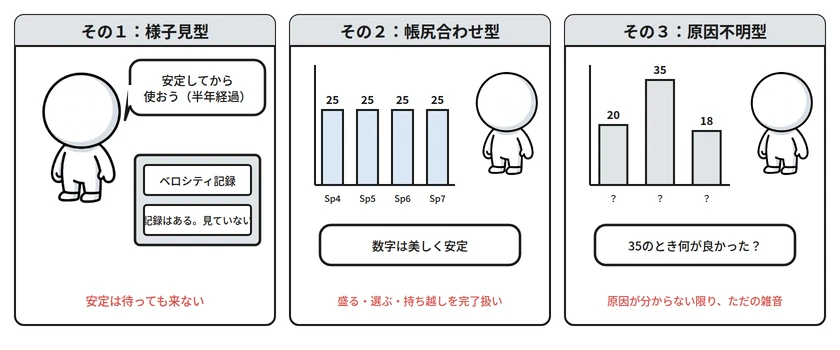
#Teams troubled by variation tend to fall into several anti-patterns. Compare them with how your own team handles its numbers.
Pattern 1: The Wait-and-See Type — This type decides, “We will not use velocity until it stabilizes,” and creates plans through intuition and determination. They record the numbers but do not look at them. Stability will not come no matter how long they wait, so this waiting continues forever.
Pattern 2: The Number-Adjusting Type — This type makes “stabilizing” velocity its goal. It usually begins when management starts demanding explanations such as, “It was 35 last month, so why is it 18 this month?” It happens almost inevitably in organizations where velocity begins to be used for evaluation or comparison between teams. From then on, the team starts paying attention to avoiding lower numbers: inflating estimates, selecting only items that seem likely to finish, or quietly treating carried-over items as completed. The numbers become beautifully stable, while the reality does not improve at all. Goodhart’s Law, which we saw in No. 9, is waiting here as well. In the special edition, I wrote that variation in estimates is acceptable, but bias remains in the total. Number-adjusting creates exactly that bias.
Pattern 3: The Unknown-Cause Type — This type records the numbers but does not retain what happened during each sprint. Even when looking over half a year of data, they cannot tell “what went well when it was 35” or “what happened when it was 18.” Variation is merely noise until its causes are understood.
Misconceptions About Variation
#Although they look different, all three patterns—as well as the questioner’s practice of “planning with the average”—come from the same misconception: velocity is a precise measurement. Once you adopt this assumption, it naturally follows that variation is measurement error, that taking an average gets you closer to the true value, that unstable figures cannot be used, and that lower figures require explanation. All of these are straightforward applications of that assumption. Just as the conversion table in No. 9 fixed moving actual results into one coefficient, an average fixes variation into one number. The appearance differs, but what is happening is the same.
Now, let us resolve the three questions one by one.
First, is something wrong if it has not stabilized even after half a year? No, nothing is wrong. Velocity is not a physical constant; it is an observation record of a living thing called a team. Team members’ vacations, the volume of interruptions, uneven PBI granularity, fluctuations in estimation criteria—every one of these is reflected in the number. If it continues to fluctuate after half a year, that merely means the team is still alive after half a year. What becomes stable is the range of fluctuations. A range such as 18–35 becomes more trustworthy as actual results accumulate, and it narrows as you eliminate the causes.
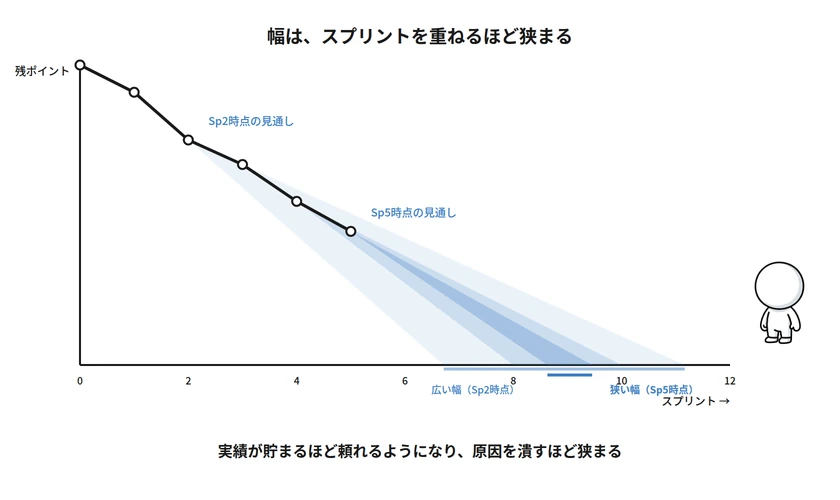
Next, would it not be strange for it to stabilize when the reasons differ every time? That is exactly right. Therefore, rather than trying to eliminate variation, we use a method that incorporates variation into the forecast. That method is the range. Speaking in ranges is a trade-off: reducing precision in order to increase accuracy. It is better to be right with a wide range than wrong with a narrow one. Planning needs the former. In addition, observe the causes of variation and address only those that can be addressed. Accept vacations and unexpected incidents as part of the range, while improving how interruptions are accepted and the granularity of PBIs. Once you can make this distinction, the discussion changes from “we cannot use it because it varies” to “can we eliminate this cause?”
And then, how do you explain something that does not stabilize to management? Explain it as a range. The range-based release forecast we saw in No. 9 is derived precisely from these worst-case and best-case values. “Our velocity is 18–35. Therefore, the remaining work will take 6–11 sprints.” When an external party requires a single date, commit to the date on the pessimistic side, and use the range for internal planning and progress management. In No. 5, I wrote that when submitting the velocity measured in actual sprints for a system renewal project as an approval request, you should use the upper-bound values for duration and cost. That is also a use of this range. As the range narrows, the committed date can be reviewed and moved forward.
The remaining question is: why do we assume it is a “precise measurement”? Many of us have been taught that planning is done using a single number. A deadline is one date, and effort is one number. When we encounter velocity in this culture, wanting to turn it into “one number with little variation” is a natural reaction. It is nobody’s fault. It is simply that the purpose of velocity has not been communicated as clearly as the explanation of its units.
So what is velocity originally for? In No. 9, I wrote that story points are a tool for “forecasting from actual results.” In the special edition, I wrote that estimation error is determined not by the method, but by the size of the item and the time until the answer can be verified. Velocity is the “actual results” side of that equation: it is the record of verification for each sprint.
Observe — Record the points completed in each sprint exactly as they are. Do not inflate them, do not reduce them, and do not count carried-over work. This honesty is the foundation of everything that follows.
Inspect — Line up the records and examine the range and the causes of variation. The gap between forecast and actual results is not failure; it is information for correcting the next plan.
Adapt — Create the next plan using a range, improve the causes that can be eliminated, and accept those that cannot as part of the range. As more sprints accumulate, the range narrows and planning becomes more accurate.
Applied to these three stages, we can see where the questioner’s practice of “planning with the average” stops. They are observing, but they are not inspecting the variation; they crush it into an average and use that for planning. The number-adjusting type even distorts observation itself. Instead of “creating one number with little fluctuation,” the approach is “retain a range, read the causes, and plan with the range.” Put differently, that is all there is to it. If you try only the prescriptions without this change in perspective, it will not last.
Prescription
#The items below are tools, not objectives. There are many forecasting techniques to choose from, including some discussed as extensions in No. 9, and any of them may be used. However, if you merely say, “We changed it to a range,” you have only increased the number of averages from one to two. After trying them, verify whether your plans have become more accurate and whether the causes of variation have decreased.
First, leave a one-line note next to the number
Before taking action, begin with recording. For each sprint, leave a one-line note alongside the velocity number. For example: “35: no long holiday, few interruptions,” or “18: 3 person-days spent responding to a production incident, Mr./Ms. ◯◯ on vacation.” Once you accumulate several sprints of these notes, you can categorize the causes of variation. Improve what can be addressed—such as the way interruptions are accepted or inconsistent PBI granularity—and accept what cannot be addressed—such as vacations and unexpected incidents—as part of the range. This is the only way out of the unknown-cause type, and the prescriptions that follow only work when these records exist.
Use a range instead of an average
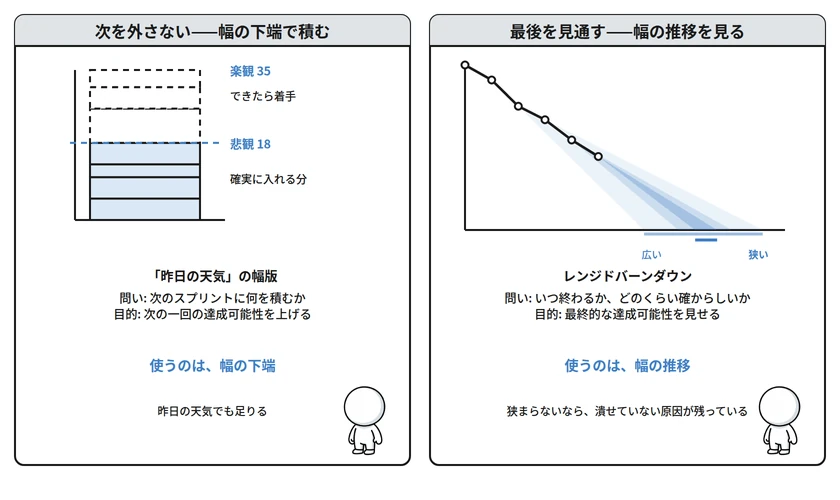
As we saw in No. 9, creating a range simply means taking the worst and best values from the actual results of the most recent 5–8 sprints. What this article adds is how to use that range in sprint planning. Put simply, it is a range-based version of “yesterday’s weather”: carry forward the conservatism of committing only to what you can accomplish using the pessimistic value, and prepare ways to use remaining capacity using the optimistic value. In planning the next sprint, assuming “pessimistic 18, optimistic 35,” load the work you will definitely include up to the pessimistic value, and list the rest as candidates to “start if possible.” The work planned using the pessimistic value becomes the foundation of the sprint goal, while candidate items are picked up when extra capacity becomes available.
Incidentally, immediately after introduction, when there are only 2–3 sprints of actual results, even the range is not reliable yet. During that time, do not seek forecasting accuracy; simply consider it a “period for accumulating actual results” and continue recording. The range generally begins to have meaning around the fifth sprint. The difference from the wait-and-see type is that you keep recording and looking at the data while waiting.
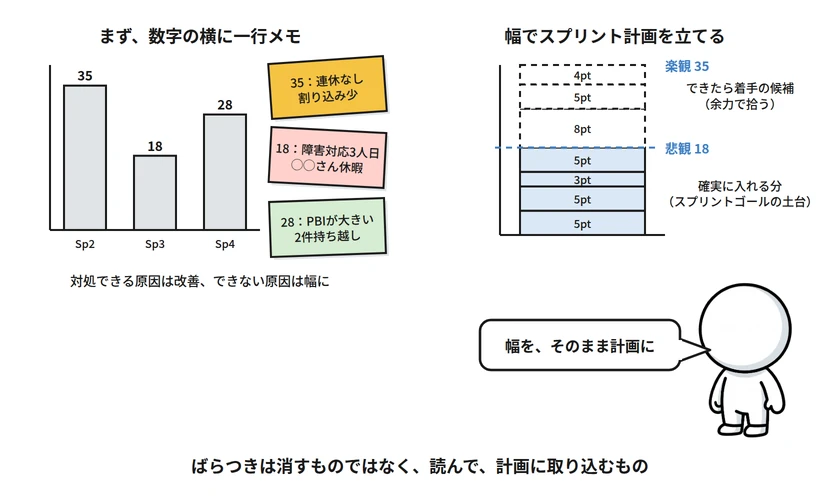
Use the trend of the range to see the finish
There are two uses for a range. One is to avoid missing the next sprint: use the lower end of the range—the pessimistic value—to load the plan. This was the previous prescription: a range-based version of “yesterday’s weather,” intended to improve the achievability of the next single sprint. The other is to see the finish: use the movement of the range. Dividing the remaining points by the range makes the completion timing a range as well. If that range narrows as sprints accumulate, the outlook is becoming more certain. If it does not narrow, causes that have not been eliminated remain. Yesterday’s weather is sufficient for the former, but it does not show the latter—how certain the eventual outcome is. What shows that is the range-based burndown discussed in No. 9. Use the lower end of the range to protect the next sprint, and use the range trend to see the finish. These are different ways of reading the same range.
Agree with the organization on how velocity will be used
Velocity is an internal metric used by the team to improve the accuracy of its own planning. As explained regarding points in No. 9, when it is repurposed for evaluation, comparison, or targets, the number becomes a tool for self-protection—and velocity is no different. This means drawing the same line for velocity numbers themselves as the line drawn in No. 9 between “external currency” and “an internal tool” for conversion values. Agree on this boundary with management early and explicitly—before “report why velocity went down” begins. This also cannot be completed by the team alone. The team should disclose the range and notes on causes in the same format every time, while management should look not at whether the number rises or falls, but at “is the range narrowing?” and “are the causes we can eliminate decreasing?” This back-and-forth blocks the entrance to the number-adjusting type.
Why Has This Question Been Repeated for 30 Years?
#As seen earlier, the culture of creating plans from a single number cannot be overwritten by one training session. Moreover, every time new members join, they bring it into the team. That is why voices frustrated by velocity variation are inevitably reproduced with every generational change in the team.
However, agile planning does not aim to eliminate uncertainty; it aims to move forward together with uncertainty. When you feel frustrated with variation in velocity, it is time to adjust not the number, but the expectations placed on it. Is the range narrowing? Are the causes of variation decreasing? Regularly asking yourselves these questions confirms whether your team’s velocity is functioning as a planning tool.
Bonus: What Is the Difference Between Converting Each Item and Dividing the Total by Velocity?
#In No. 9, I wrote that a conversion value such as “1 point = ◯ person-days” is a number used to discuss the cost of an item, while velocity is a number used to discuss the flow rate of a team; they may look similar but are fundamentally different. Then this question comes back: “Isn’t assigning points to each item and dividing the total by velocity ultimately the same as multiplying each item by a conversion value and adding them up?” It is a good question, so I will expand here on the answer that I kept brief in No. 9.
First, the arithmetic. If you create a conversion value as “team person-days per sprint ÷ velocity,” then the sum of each item’s points × conversion value equals conversion value × total points—in other words, total points ÷ velocity × team person-days per sprint. If you recalculate the conversion value every sprint and use it only for the total, it is merely another notation for “dividing the total by velocity.” In that case, there is no difference between the two. The difference emerges because what happens in actual practice departs from this ideal form in four ways.
What is fixed — The method of dividing the total by velocity can handle velocity as a moving value that is re-observed every sprint, while retaining its range—18–35. Consequently, the forecast also becomes a range, and as seen in this article, it becomes more reliable as actual results accumulate and narrows as causes are eliminated. A conversion value becomes a single constant the moment it is created from actual results; once it is distributed as a table, it stops being updated, and the range disappears as well. In theory, “you could update the conversion value every time with a range,” but I have never seen a conversion table that actually does this. The very act of making it into a table invites fixation.
Where the number is attached — With the divide-the-total method, person-days and costs are attached only to the total, not to individual items. When you multiply each item by a conversion value, a figure such as “this item is 3 person-days” is generated at the item level. Side effects then cascade from this. People can haggle over each item, blame someone who took five days for a three-person-day item, compare unit costs across teams, and estimators then inflate points in anticipation of this. The moment money is attached to an item, points turn into performance indicators and Goodhart’s Law begins to operate. If numbers are attached only to the total, individual estimates are not subjected to pressure, preserving the speed and ease of agreement provided by relative comparison. Of the four patterns in No. 9—the mapping-table type, report-card type, haggling type, and silence type—the first three, excluding the silence type, arise from here.
Whether the inspection-and-adaptation loop turns — Velocity is measured afterward and returns to the next forecast, so the divide-the-total method self-corrects every sprint. Deviations appear as “forecast updates.” When a conversion value is applied at the estimation stage, the plan is fixed at that point, and gaps from reality appear as “delays.” Even with the same deviation, one becomes learning while the other becomes a matter of accountability. Saying “this time was exceptional” every time a plan based on the average misses is what it looks like when this loop is not turning.
The accounting unit — Total ÷ velocity × the team’s monthly cost calculates “how many months will this team operate?” It fits naturally with a model that funds a fixed team by duration. Assigning person-days to each item calculates “cost per deliverable,” drawing you toward a model that requires estimation accuracy at the item level and re-estimation and re-approval with every change. This is why, in the prescription in No. 9, I answered “how much will it cost?” in terms of the team’s operating cost.
One more common practical pitfall. In quite a few workplaces, the 0.5 in “1 point = 0.5 person-days” is not derived from velocity, but set using an “ideal day.” In that case, the team’s actual throughput, including meetings and interruptions, is not included in the formula, resulting in systematic underestimation. The method of dividing by velocity automatically includes that kind of overhead as a measured value. Sprints with “many interruptions” written in the one-line note from this article are silently included within the range as well.
To summarize: the calculation result is the same if a conversion value is created and used correctly. What differs is whether velocity is handled as a moving observation or fixed as a constant; whether person-days are attached only to the total or to each item; and, as a result, whether the inspection-and-adaptation loop turns or stops. In short: do not turn the team’s flow rate into the cost of individual items. Ultimately, that is the one thing I wanted to say through both No. 9 and this article.
Next time: “Tasks that do not finish within the sprint occur every time”