Monitoring Lambda SLOs with CloudWatch Application Signals
Back to TopTo reach a broader audience, this article has been translated from Japanese.
You can find the original version here.
Last month, CloudWatch Application Signals added support for AWS Lambda.
CloudWatch Application Signals is a new APM (Application Performance Monitoring) feature that debuted as a preview in 2023 and just became Generally Available (GA) this year.
Until now, it only supported EKS, ECS, and EC2, but it finally supports Lambda.
Application Signals intuitively visualizes metrics collected using OpenTelemetry as dashboards and service maps.
Furthermore, based on SLOs (Service Level Objectives), it supports rational operational improvements from a business perspective by measuring and managing the system's goal achievement.
This time, we will try this feature, which is gaining attention as AWS's standard APM tool, targeting Lambda functions.
Enabling Application Signals
#To allow Application Signals to perform service discovery and measure SLOs, you need to grant access permissions to logs and metrics once initially.
Here, we enabled it via the Management Console.
Step 2 is to enable it for each service, so no action is needed here.
Implementing the Lambda Function to Monitor
#First, we will create a Lambda function to monitor.
Here, we created the following Lambda event handler.
import type { APIGatewayProxyHandler } from 'aws-lambda';
import { PutObjectCommand, S3Client } from '@aws-sdk/client-s3';

const s3client = new S3Client();
const handler: APIGatewayProxyHandler = async () => {

  await s3client.send(new PutObjectCommand({
    Bucket: process.env.BUCKET_NAME ?? '',
    Key: Date.now().toString() + '.txt',
    Body: 'lambda-app-signal-test'
  }))
  const rand = Math.random();
  // Fail with 5% probability
  const success = rand > 0.05;
  if (!success) {
    throw new Error('oops!');
  }
  return {
    statusCode: 200,
    body: JSON.stringify({
      message: 'ok!',
    }),
  };
}

// Currently, when using ADOT with TypeScript, there is a constraint that prevents using the export statement
// https://github.com/aws-observability/aws-otel-lambda/issues/99#issuecomment-919993949
module.exports = { handler }
After putting to an S3 bucket, it generates an error with a 5% probability.
Enable Application Signals and Deploy the Lambda Function
#We will deploy the created Lambda function.
Here, we use AWS CDK.
import * as cdk from 'aws-cdk-lib';
import { Construct } from 'constructs';
import * as s3 from 'aws-cdk-lib/aws-s3';
import * as iam from 'aws-cdk-lib/aws-iam';
import * as nodejs from 'aws-cdk-lib/aws-lambda-nodejs';
import * as lambda from 'aws-cdk-lib/aws-lambda';

export class LambdaAppSignalStack extends cdk.Stack {
  constructor(scope: Construct, id: string, props?: cdk.StackProps) {
    super(scope, id, props);

    const bucket = new s3.Bucket(this, 'SampleBucket');
    const role = new iam.Role(this, 'LambdaRole', {
      assumedBy: new iam.ServicePrincipal('lambda.amazonaws.com'),
      managedPolicies: [
        iam.ManagedPolicy.fromAwsManagedPolicyName('service-role/AWSLambdaBasicExecutionRole'),
        // 1. Application Signals AWS Managed Policy
        iam.ManagedPolicy.fromAwsManagedPolicyName('CloudWatchLambdaApplicationSignalsExecutionRolePolicy')
      ],
      inlinePolicies: {
        s3policy: new iam.PolicyDocument({
          statements: [
            new iam.PolicyStatement({
              actions: ['s3:PutObject'],
              resources: [bucket.bucketArn + '/*']
            })
          ]
        })
      }
    });

    // Retrieve the ARN of the ADOT Lambda Layer from below
    // https://docs.aws.amazon.com/AmazonCloudWatch/latest/monitoring/CloudWatch-Application-Signals-Enable-Lambda.html#Enable-Lambda-Layers
    const awsOtelDistro = lambda.LayerVersion.fromLayerVersionArn(this, 'AWSOtelExtension',
      'arn:aws:lambda:ap-northeast-1:615299751070:layer:AWSOpenTelemetryDistroJs:5');
    const func = new nodejs.NodejsFunction(this, 'SampleFunction', {
      role,
      functionName: 'flaky-api-for-app-signals',
      entry: './lambda/index.ts',
      handler: 'handler',
      // Enable X-Ray Active Tracing (optional)
      tracing: lambda.Tracing.ACTIVE,
      // 2. ADOT Layer
      layers: [awsOtelDistro],
      runtime: lambda.Runtime.NODEJS_22_X,
      timeout: cdk.Duration.seconds(10),
      environment: {
        BUCKET_NAME: bucket.bucketName,
        // 3. Enable Application Signals
        AWS_LAMBDA_EXEC_WRAPPER: '/opt/otel-instrument'
      }
    });
    const url = new lambda.FunctionUrl(this, 'SampleFunctionUrl', {
      function: func,
      authType: lambda.FunctionUrlAuthType.NONE
    });

    new cdk.CfnOutput(this, 'SampleFunctionUrlOutput', {
      value: url.url
    });
    new cdk.CfnOutput(this, 'BucketNameOutput', {
      value: bucket.bucketName
    });
  }
}
The points to use Application Signals with Lambda are as follows.
- Specify the following AWS Managed Policy to the Lambda's execution role
CloudWatchLambdaApplicationSignalsExecutionRolePolicy
- Add the ADOT (AWS Distro for OpenTelemetry) provided by AWS as a Lambda Layer
- Set the environment variable
AWS_LAMBDA_EXEC_WRAPPERto/opt/otel-instrument
Use the AWS ADOT Lambda Layer described in the official documentation.
It's not mandatory, but the official documentation also recommends enabling X-Ray Active Tracing.
Deploy this.
cdk deploy
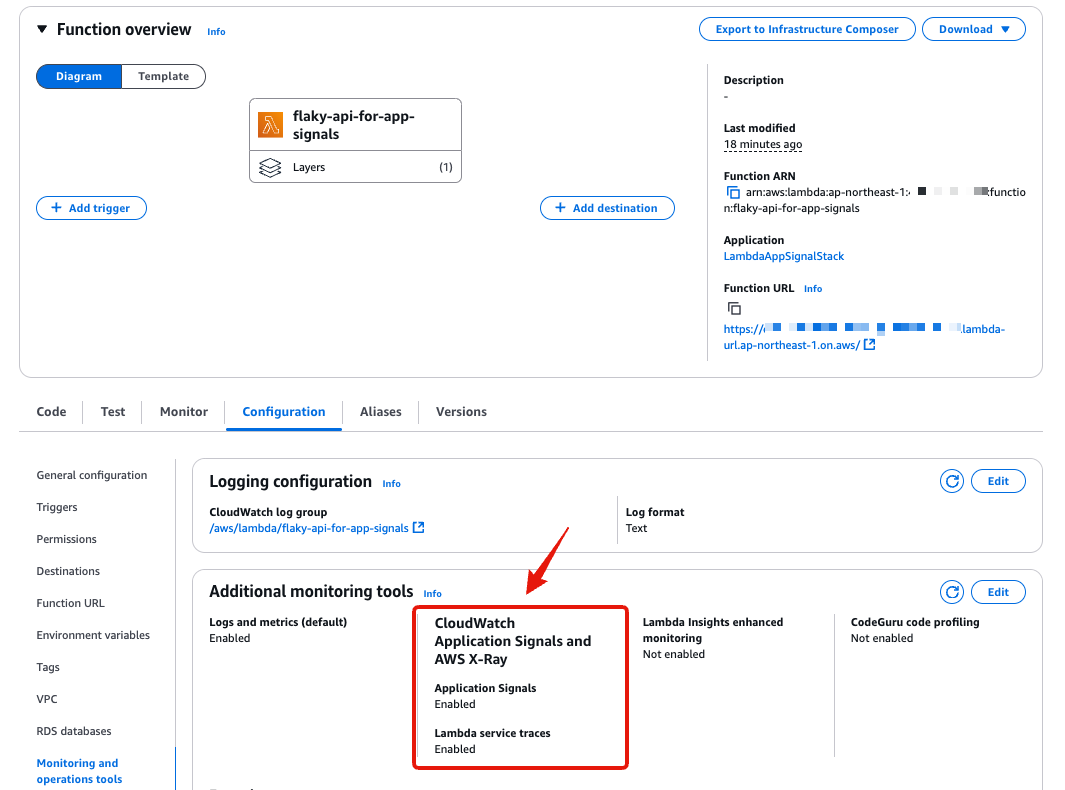
After deployment, check the Lambda status from the Management Console.
Application Signals and X-Ray tracing are enabled.
Since Lambda Function URL is enabled, it can be accessed from tools like curl.
curl https://xxxxxxxxxxxxxxxxxx.lambda-url.ap-northeast-1.on.aws/
# {"message":"ok!"}
Checking Application Signals Services and Service Maps
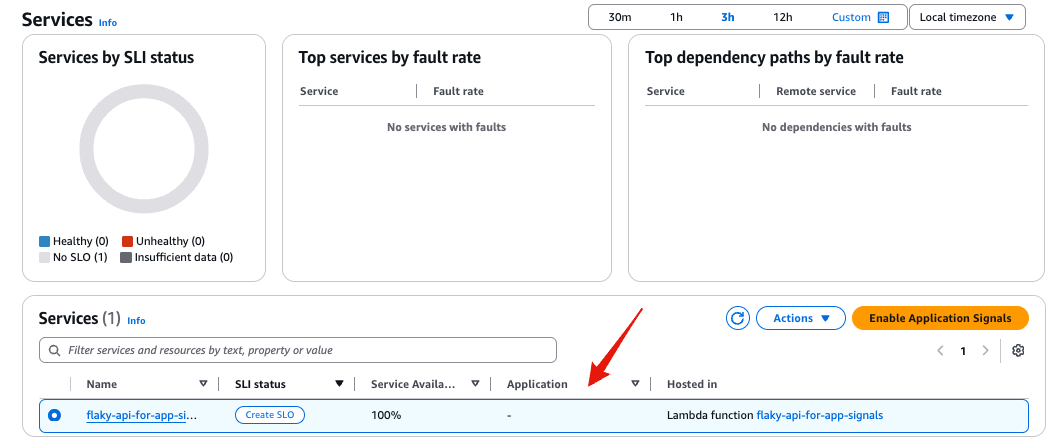
#When traffic occurs on the target service, Application Signals detects the addition of services, and they can be checked from Application Signals (automatic detection).
This process takes some time (about 5 minutes).
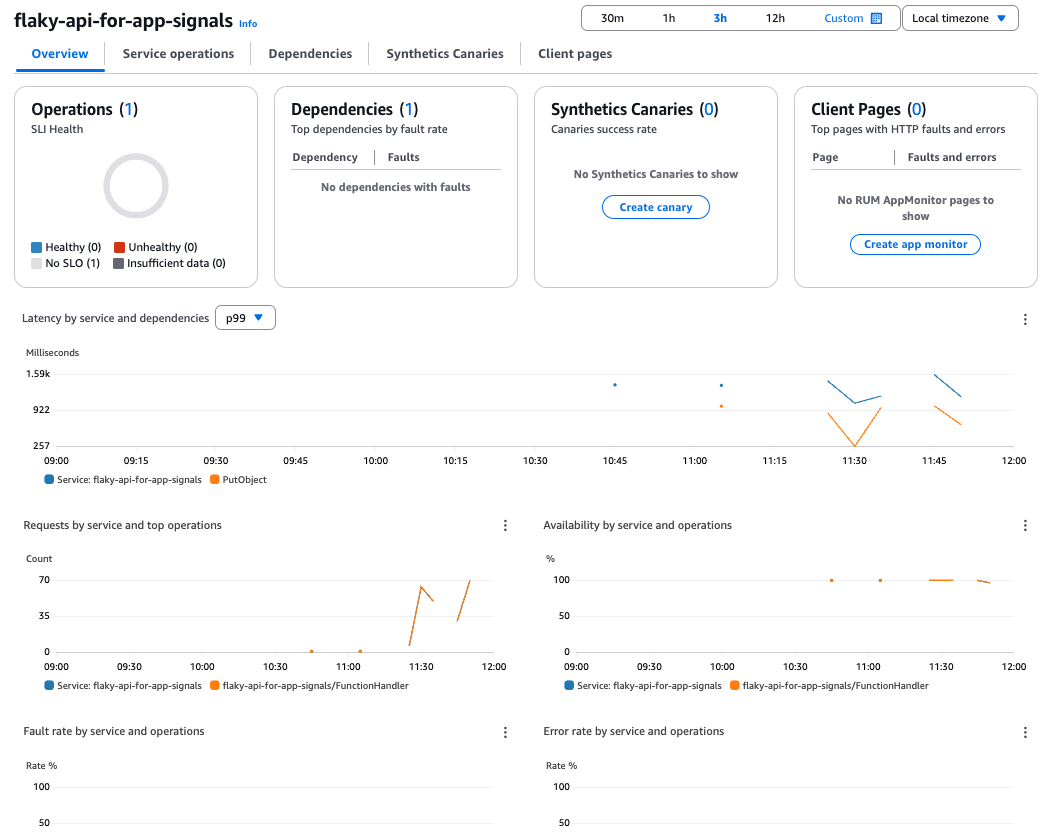
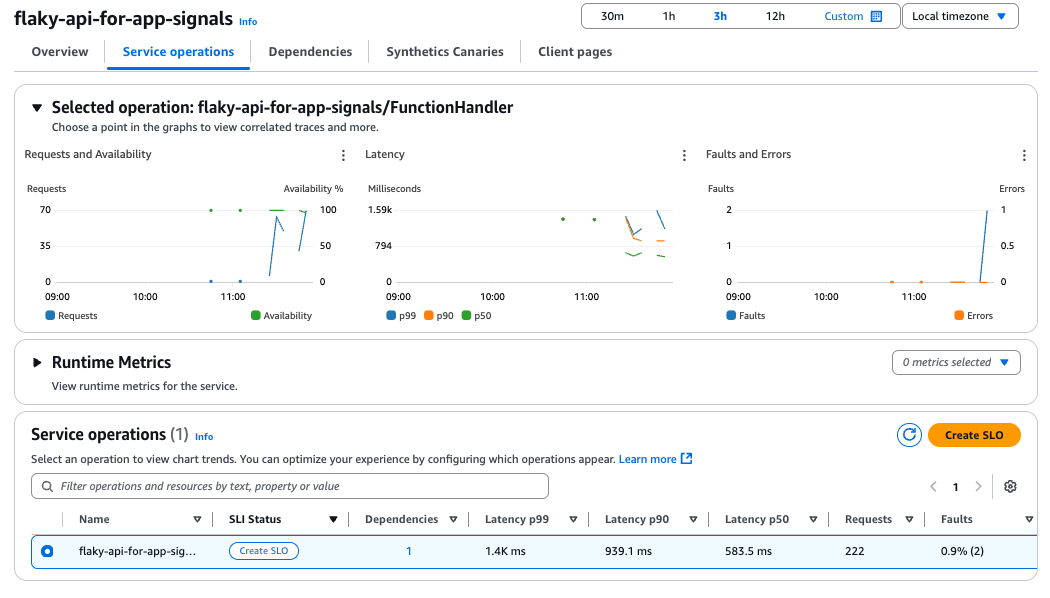
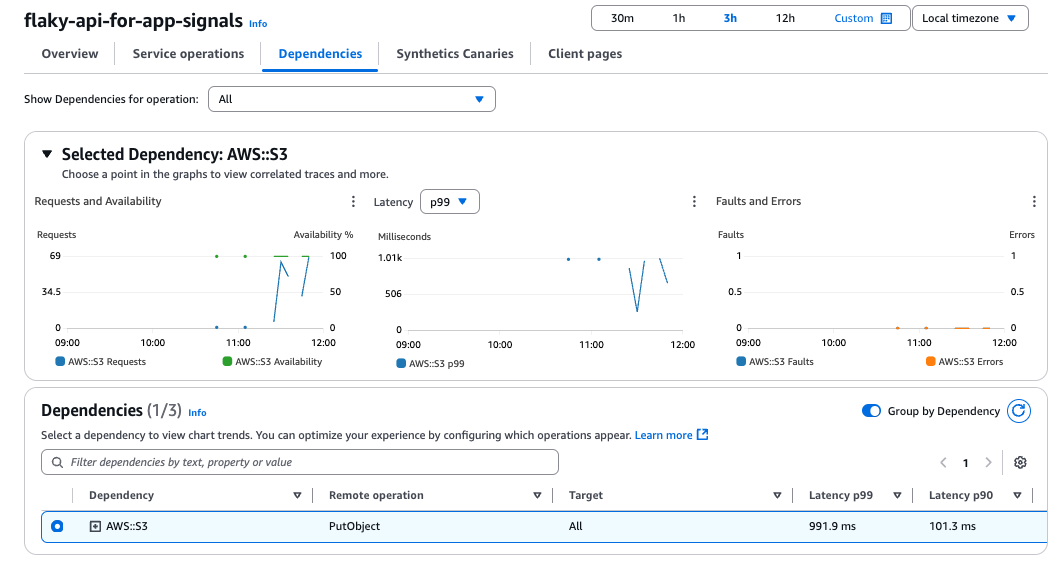
Clicking on the service name allows you to check the details of the service.
Since we're not using Synthetics Canaries and Client Pages this time, nothing is displayed.
The sample size is small and doesn't look great, but the Lambda metrics and dependencies (S3) are visualized.
Analyzing with X-Ray as needed can make bottlenecks more visible.
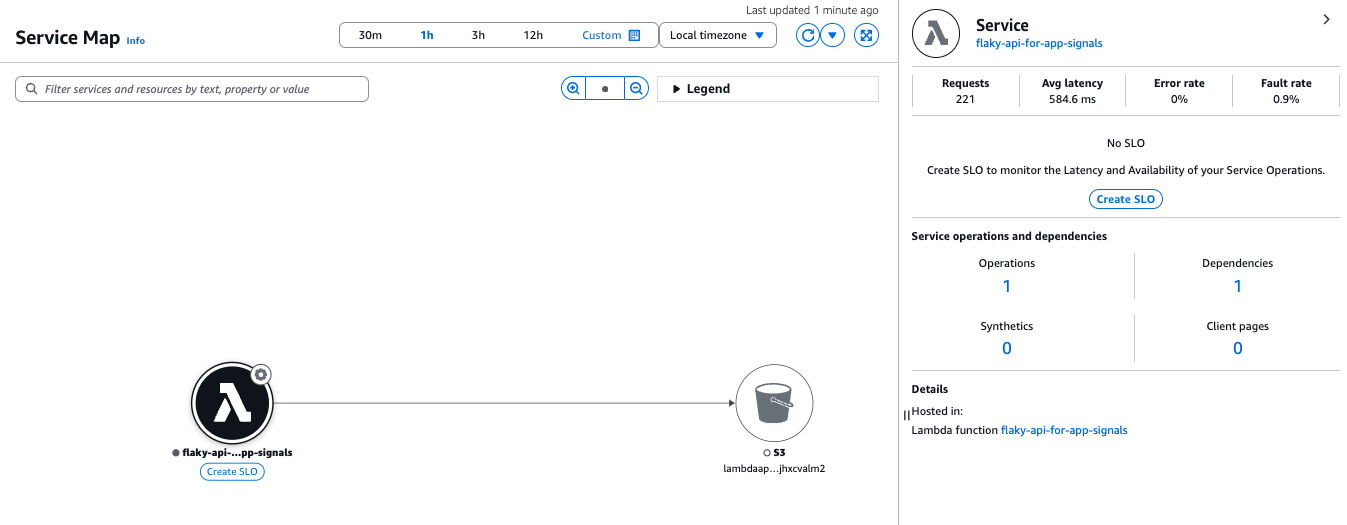
Next, check the Service Map of Application Signals.
The relationship between the Lambda we created and the S3 bucket is visualized (it looks similar to the X-Ray trace map).
Clicking on each node and edge allows you to view the relevant metrics.
Defining an SLO
#We have taken a look at the auto-detection and dashboards provided by Application Signals, but let's define an SLO to enable monitoring from a business perspective.
It's a bit long, but it's documented in:
Here too, we will use AWS CDK to create an SLO.
Currently, Application Signals only has L1 constructs, so it's equivalent to writing in CloudFormation.
if (this.node.tryGetContext('createSLO') === 'true') {
  const availabilitySLO = new applicationsignals.CfnServiceLevelObjective(this, 'AvailabilityServiceLevelObjective', {
     name: `${func.functionName}-availability`,
     requestBasedSli: {
        requestBasedSliMetric: {
           metricType: 'AVAILABILITY',
           keyAttributes: {
              'Type': 'Service',
              'Name': func.functionName,
              'Environment': 'lambda:default'
           },
           operationName: `${func.functionName}/FunctionHandler`
        }
     },
     goal: {
        attainmentGoal: 95,
        warningThreshold: 30,
        interval: {
           rollingInterval: {
              duration: 1,
              durationUnit: 'DAY' // DAY | MONTH
           }
        }
     },
     // Burn rate (time frames of 5 minutes and 60 minutes)
     burnRateConfigurations: [
        { lookBackWindowMinutes: 5 },
        { lookBackWindowMinutes: 60 }
     ]
   });
}
In this SLO definition, we have:
SLI (Service Level Indicator)
This is the metric used as an indicator for the SLO.
The selected indicator can be either availability (AVAILABILITY) or latency (LATENCY) by default. Here, we specified AVAILABILITY.
Alternatively, you can specify any CloudWatch metrics of the monitoring target service.
Also, there are two options for how to calculate the indicator: evaluating at regular intervals, or calculating based on the number of requests. Here, we adopted the request-based method, which is simpler to calculate.
SLO Goal (goal)
The Lambda function we created earlier is set to fail with a 5% probability.
To match this, we set the SLO attainment goal (attainmentGoal) to "95%", intentionally creating a situation where the goal is barely met or not.
We use a rolling interval (rollingInterval) that monitors over one day, sliding to always monitor the most recent metrics from the current time.
The rolling interval has the advantage of quickly detecting short-term anomalies.
Alternatively, using a calendar interval (calendarInterval), you can monitor over a fixed period.
The calendar interval is effective in visualizing from a business perspective and explaining to stakeholders, so it is effective to use them depending on the situation.
Burn Rate (burnRateConfigurations)
It might seem a little complicated, but the burn rate is a metric that indicates how quickly the error budget (allowable errors) is being consumed within a specified period (details are explained in the column below).
The concept of burn rate is advocated in Google's Site Reliability Workbook, stating that combining long-term and short-term look-back windows enables reliable alerts.
Following this, we set look-back windows of 5 minutes and 60 minutes.
The calculation formula is simple. It's defined as the actual error rate (%) during the period divided by the error budget (%).
The error budget is the value obtained by subtracting the SLO goal value from 1 (99% would be 1%). As the name suggests, it indicates the budget of allowable errors within the SLO period.
Depending on the size of the burn rate, it is interpreted as follows:
- When it's 1: The pace at which the error budget is exactly used up.
- When it's more than 1: The error budget is being consumed at a pace where it will run out before the end of the SLO period, so action is needed.
- When it's less than 1: The error budget is within the acceptable range. Ideally, but it may be considered that no risks are being taken.
For example, let's consider the burn rate of the above availability SLO.
If there were 1000 requests within the look-back window, and errors occurred in 200 requests, the calculation is as follows:
- Error Budget: 100% - 95% = 5%
- Actual Error Rate: 200 / 1000 * 100 = 20%
- Burn Rate: 20% / 5% = 4
This means that the error budget is being consumed at four times the planned speed.
If this state continues, the error budget will be exhausted in 1/4 (6 hours) of the SLO monitoring period (1 day), so immediate action is required.
Let's deploy the SLO. This time, we'll run it with the parameter createSLO set to true.
cdk deploy --context createSLO=true
SLOs cannot be created until Application Signals have detected the services.
In other words, trying to create the SLO at the same time as creating the Lambda will result in a deployment error because the target service cannot be found.
To avoid this, as we do here, you need to adjust the deployment timing by using a flag (createSLO), separating the stack, or other means.
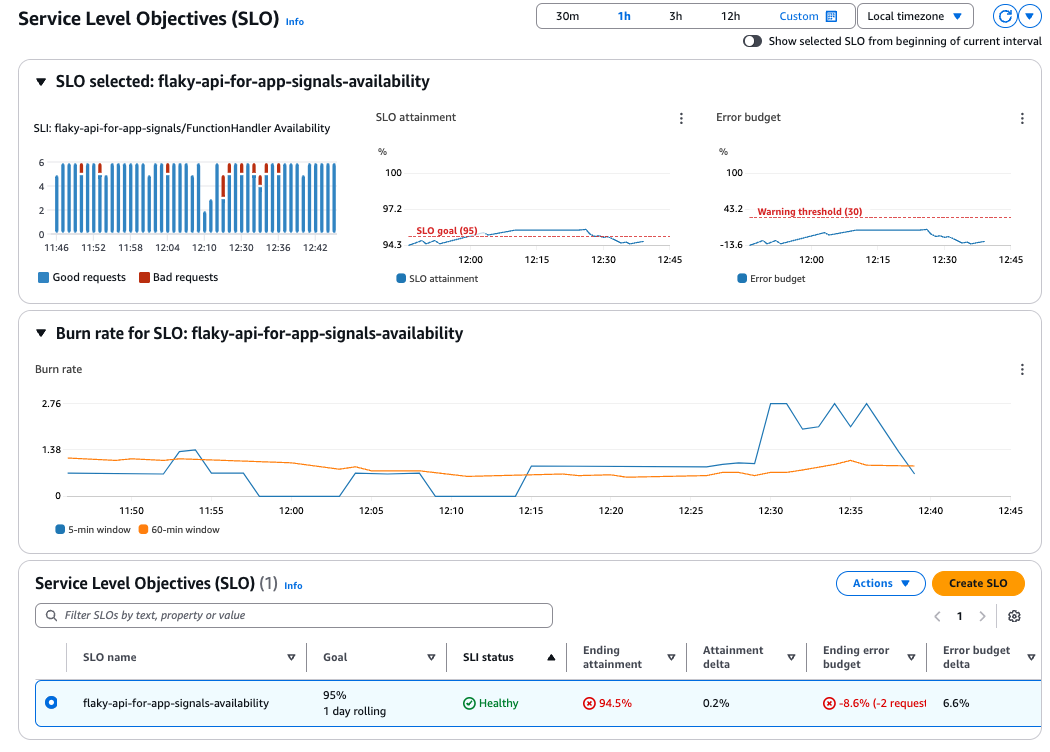
Check the SLO in Application Signals from the Management Console.
Just by defining the SLO, it automatically creates a nice dashboard.
This time, it shows 94.5%, which means that the availability is not meeting the SLO target of 95% (we have exceeded the error budget by 2 requests).
Also, looking at the burn rate graph in the middle, we can see that the short-term look-back window (5 minutes) is sensitive to request failures, while the long-term look-back window (60 minutes) is smoothed out.
Creating CloudWatch Alarms Based on SLOs
#We have defined the SLO and visualized the current state, but it is meaningless unless we build a notification mechanism.
Application Signals itself only sends SLO-related metrics to CloudWatch, and monitoring these metrics and triggering alarms is the role of CloudWatch Alarms.
This time we will create the following three alerts.
- Error budget remaining 30%
- Error budget depleted (= SLO not achieved)
- Short-term and long-term burn rates
1. Error budget remaining 30%
#const warningAlarm = new cloudwatch.Alarm(this, 'AvailabilityWarningAlarm', {
alarmName: `SLO-WarningAlarm-${availabilitySLO.name}`,
alarmDescription: 'Threshold alarm when SLO warning (remaining 30%) is exceeded',
actionsEnabled: true,
evaluationPeriods: 1,
datapointsToAlarm: 1,
threshold: 100 - (5 * (1 - 0.3)), // 96.5%
comparisonOperator: cloudwatch.ComparisonOperator.LESS_THAN_OR_EQUAL_TO_THRESHOLD,
metric: new cloudwatch.Metric({
metricName: 'AttainmentRate',
namespace: 'AWS/ApplicationSignals',
statistic: cloudwatch.Stats.AVERAGE,
dimensionsMap: {
SloName: availabilitySLO.name
},
unit: cloudwatch.Unit.PERCENT,
period: cdk.Duration.minutes(1)
})
});
warningAlarm.addAlarmAction(new actions.SnsAction(/* alarm action */));
Application Signals sends metrics to the AWS/ApplicationSignals namespace.
Among them, the metric AttainmentRate is sent with the current SLO attainment rate.
So we can monitor this.
Here, we set it to notify when 70% (3.5%) of the 5% error budget has been consumed, that is, when the attainment rate falls below 96.5%.
2. Error budget depleted (= SLO not achieved)
#const attainmentAlarm = new cloudwatch.Alarm(this, 'AvailabilityAttainmentGoalAlarm', {
alarmName: `SLO-AttainmentGoalAlarm-${availabilitySLO.name}`,
alarmDescription: 'Threshold alarm when SLO goal is exceeded',
actionsEnabled: true,
evaluationPeriods: 1,
datapointsToAlarm: 1,
threshold: 95, // Same value as availabilitySLO's goal.attainmentGoal
comparisonOperator: cloudwatch.ComparisonOperator.LESS_THAN_OR_EQUAL_TO_THRESHOLD,
metric: new cloudwatch.Metric({
metricName: 'AttainmentRate',
namespace: 'AWS/ApplicationSignals',
statistic: cloudwatch.Stats.AVERAGE,
dimensionsMap: {
SloName: availabilitySLO.name
},
unit: cloudwatch.Unit.PERCENT,
period: cdk.Duration.minutes(1)
})
});
attainmentAlarm.addAlarmAction(new actions.SnsAction(/* alarm action */));
The metric used is the same as the warning notification but the threshold is the same as the SLO goal value (95%).
3. Short-term and long-term burn rates
#Using an alarm for one look-back window's burn rate is fine, but here, by combining the short-term and long-term burn rates, we can improve the accuracy and reliability of alerts.
- Short-term burn rate (5 minutes): Detect and confirm that errors are currently occurring quickly. Once errors stop, it immediately falls below the threshold, and the alert is promptly cleared.
- Long-term burn rate (1 hour): Confirm sustained error trends. Filter out false detections such as spike errors in the short-term burn rate.
By combining these two burn rates with an AND condition, alerts are only triggered when short-term problems are continuously occurring, suppressing false detections while detecting essential anomalies.
To achieve this, we use Composite Alarms to combine multiple alarms.
const burnRateAlarm_5min = new cloudwatch.Alarm(this, 'AvailabilityBurnRateAlarm_5min', {
   alarmName: `SLO-BurnRate-${availabilitySLO.name}-5`,
   alarmDescription: 'Threshold alarm when burn rate (5 minutes) is exceeded',
   actionsEnabled: true,
   evaluationPeriods: 1,
   datapointsToAlarm: 1,
   // https://docs.aws.amazon.com/AmazonCloudWatch/latest/monitoring/CloudWatch-ServiceLevelObjectives.html#CloudWatch-ServiceLevelObjectives-burn
   threshold: 0.1 * (24 * 60) / 60, // 2.4: Align with the long-term look-back window (60 minutes)
   comparisonOperator: cloudwatch.ComparisonOperator.GREATER_THAN_THRESHOLD,
   metric: new cloudwatch.Metric({
      metricName: 'BurnRate',
      namespace: 'AWS/ApplicationSignals',
      statistic: cloudwatch.Stats.MAXIMUM,
      dimensionsMap: {
         SloName: availabilitySLO.name,
         BurnRateWindowMinutes: '5'
      },
      period: cdk.Duration.minutes(1)
   })
});

const burnRateAlarm_60min = new cloudwatch.Alarm(this, 'AvailabilityBurnRateAlarm_60min', {
   alarmName: `SLO-BurnRate-${availabilitySLO.name}-60`,
   alarmDescription: 'Threshold alarm when burn rate (60 minutes) is exceeded',
   actionsEnabled: true,
   evaluationPeriods: 1,
   datapointsToAlarm: 1,
   threshold: 0.1 * (24 * 60) / 60, // 2.4: 10% of error budget consumption within the period
   comparisonOperator: cloudwatch.ComparisonOperator.GREATER_THAN_THRESHOLD,
   metric: new cloudwatch.Metric({
      metricName: 'BurnRate',
      namespace: 'AWS/ApplicationSignals',
      statistic: cloudwatch.Stats.MAXIMUM,
      dimensionsMap: {
         SloName: availabilitySLO.name,
         BurnRateWindowMinutes: '60'
      },
      period: cdk.Duration.minutes(1)
   })
});

const compositeAlarm = new cloudwatch.CompositeAlarm(this, 'AvailabilityBurnRateAlarm_Composite', {
   compositeAlarmName: `SLO-BurnRate-${availabilitySLO.name}-CompositeAlarm`,
   actionsEnabled: true,
   alarmDescription: 'Composite burn rate alarm of short-term and long-term',
   alarmRule: cloudwatch.AlarmRule.allOf(burnRateAlarm_5min, burnRateAlarm_60min)
})
compositeAlarm.addAlarmAction(new actions.SnsAction(/* alarm action */));
Previously, we monitored the SLO attainment rate, but the burn rate is sent as the BurnRate metric[1], so we monitor this.
Here, the alarm threshold was calculated using the following formula.
Here, we set it so that if 10% of the error budget is consumed over the recent 60 minutes, an alert is issued, so 0.1*(24*60)/60 becomes 2.4 as the threshold[2].
Conclusion
#This time, we tried monitoring using Application Signals for Lambda.
Thanks to the automatic instrumentation provided by ADOT, there's no need to modify the application's source code, and standardized dashboards are automatically created, so no craftsmanship is required!
I think the trend towards replacing Lambda monitoring with SLO-based approaches using Application Signals will accelerate in the future.
However, the most difficult part of monitoring is "selecting metrics" and "defining alerts".
This is a point that always worries us, but it seems good to first decide on certain rules, proceed, and periodically review the results in a short-term cycle.
We want to adjust and refine through repeated operations to build a more precise monitoring system.
It can be found from the dimensions of SLO name + Look-back window (
BurnRateWindowMinutes). ↩︎In line with "6: Multiwindow, Multi-Burn-Rate Alerts" in the Google SRE Workbook, we set the thresholds of both alarms to be the same. ↩︎

