Building a Room Temperature and Humidity Monitoring System with Raspberry Pi and TWELITE
Back to TopTo reach a broader audience, this article has been translated from Japanese.
You can find the original version here.
This is the article for Day 12 of the Mamezou Developer Site Advent Calendar 2024.
Hello. I always write articles about the ultra-small computer Raspberry Pi, and this time is no different.
Although Raspberry Pi is a small and easy-to-handle computer, when monitoring room temperature and humidity, it has the following issues:
- Requires commercial (AC) power supply
- A bit expensive to deploy in large numbers
- It's troublesome to switch between parent and child devices over wireless LAN
- It looks uncool when jumper wires are sticking out of the chassis
Therefore,
- Can be battery-powered
- Compact
- Capable of wireless communication
I was looking for suitable components under these conditions, and I came across a product called TWELITE.
By combining TWELITE and Raspberry Pi, I created a simple system that collects room temperature and humidity measurements and records and displays the data on a web server, so I would like to report on that.
There seem to be similar articles online, but they are dated, and from a quick search, the applications and libraries used were not up-to-date, so I would like to point out some considerations for updating.
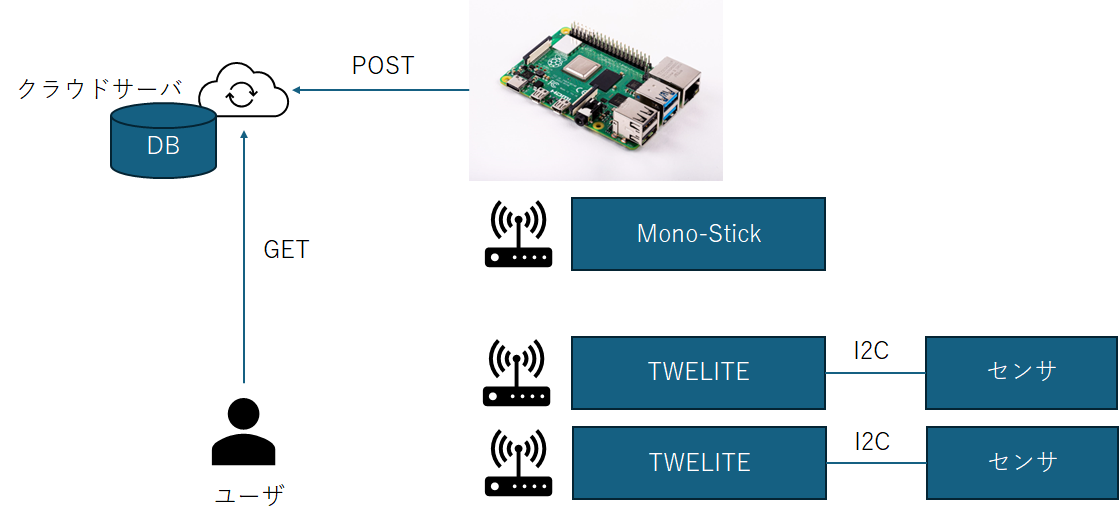
Below is an overview diagram of the system I created.
What is TWELITE
#TWELITE is a one-chip microcontroller based on RISC-V, sold by Mono Wireless Inc..
The single chip contains a CPU, IO, and wireless interface (physical layer only IEEE 802.15.4, with a proprietary stack).
It operates on extremely low power and runs on two dry-cell batteries.
Development and writing are done using dedicated software. An option to use Raspberry Pi + TWE Writer was added at some point, but this time I used the Windows version.
Connecting TWELITE and Temperature/Humidity Sensor (Electronics Work)
#As a temperature/humidity sensor, I used a module that expands the SHT-31 I had on hand into an SIP form factor. [1]
Since the communication interface of the SHT-31 is I2C, it would be easy to program by using the I2C library of TWELITE's sample app, but I tried implementing it myself for study purposes. [2]
Rewriting TWELITE for This System (Message Structure)
#Originally, TWELITE uses a syntax that's understandable to humans, but to enhance parsing efficiency in Python, I decided to use HEX notation.
| Offset | Size | Meaning |
|---|---|---|
| +00 | Byte | Fixed character ":" |
| +01 | Byte | Logical number of the sender |
| +02 | Byte | Device type (fixed at 0x04 for SHT31) |
| +03 | Byte | Room number |
| +04 | Byte | Device status (0 for normal) |
| +05 | 2-byte integer | Temperature |
| +07 | 2-byte integer | Humidity |
| +09 | Byte | Checksum (two's complement sum) |
| +10 | 2 bytes | Fixed "\r\n" |
Originally, the logical number of the sender was meant to distinguish devices, but since I created room numbers, it has become meaningless.
Set a timer for one minute, and on timeout, initiate a cold reset. As soon as measurement is complete, immediately set the timer and stop supplying power to components other than the timer. By programming like this, I was able to make it last about half a year on AA batteries.
Data Reception on Raspberry Pi Using Mono-stick
#Data measured by TWELITE are collected by the Raspberry Pi, which acts as the parent device. To receive TWELITE data, I used a mono-stick.
What is Mono-stick
#Mono-stick operates as a parent device for TWELITE and connects to the Raspberry Pi via USB.
From Raspberry Pi OS, it appears as a serial interface, so you can use /dev/ttyUSB0, etc.
Converting Received Data to Actual Temperature and Humidity
#One more step is necessary to convert the received temperature and humidity into Celsius degrees and %.
The conversion formula for temperature is as follows.
temp = -45.0 + 175.0 * measured value / (2^16 - 1)
The conversion formula for humidity is as follows.
hum = 100.0 * measured value / (2^16 - 1)
The conversion formulas differ depending on the device, but I decided to perform the conversion on the receiving program side.
Preparing the API on the Web Server Side
#Data collected by the Raspberry Pi are collected on a cloud web server and stored as measurement data.
Data are converted into JSON and sent to the server.
{
    "type": "sht31",
    "datetime: "<elapsed time>",
    "current": "<current time>",
    "from": <room number>,
    "presence": 128,
    "status": <status returned by the device>,
    "temperature": <temperature>
    "humidity": <humidity>
}
The program on the Raspberry Pi side is written in Python 3, and the program on the web server side is written in PHP.
Transmission from Raspberry Pi
#Initially, I wrote a program that would transfer data to the web server every time it received data, but when the number of rooms increases, it doesn't scale well.
Therefore, I set the communication interval to one minute, and during that time, accumulated the messages received from TWELITE into a queue.
Because of that, the reception time (timestamp) is stamped at the time of data reception.
def dataPoster(js):
    jse = js.encode()
    urllib.request.urlopen("<url>", data=jse)

queue = []
lasttime = time.time()
s = serial.Serial(port="/dev/ttyUSB0", baudrate=1152000, timeout=30)
while True:
    data = s.readline()
    parsed = parse(data)
    ctime = time.time()
    if ctime - lasttime >= 60:
        if len(queue) > 0:
            dataPoster(json.dumps(queue))
        queue = []
        lasttime = ctime
Reception on the Web Server
#On the web server side, the received data are parsed and stored in a database (Sqlite3). It is necessary to consider the possibility of receiving multiple data at once, but otherwise, it's standard API coding.
I set it up so that when the temperature rises above a certain threshold (26 degrees) or drops below another threshold (18 degrees), a threshold alert is sent via email.
Graph Display on the Web Server
#To make the accumulated data viewable at any time, I added a GUI to the web server.
When you input the room number, display interval, current device status, elapsed time since data collection started, etc., the corresponding graph is displayed.
I decided to use Google Charts for graph display.
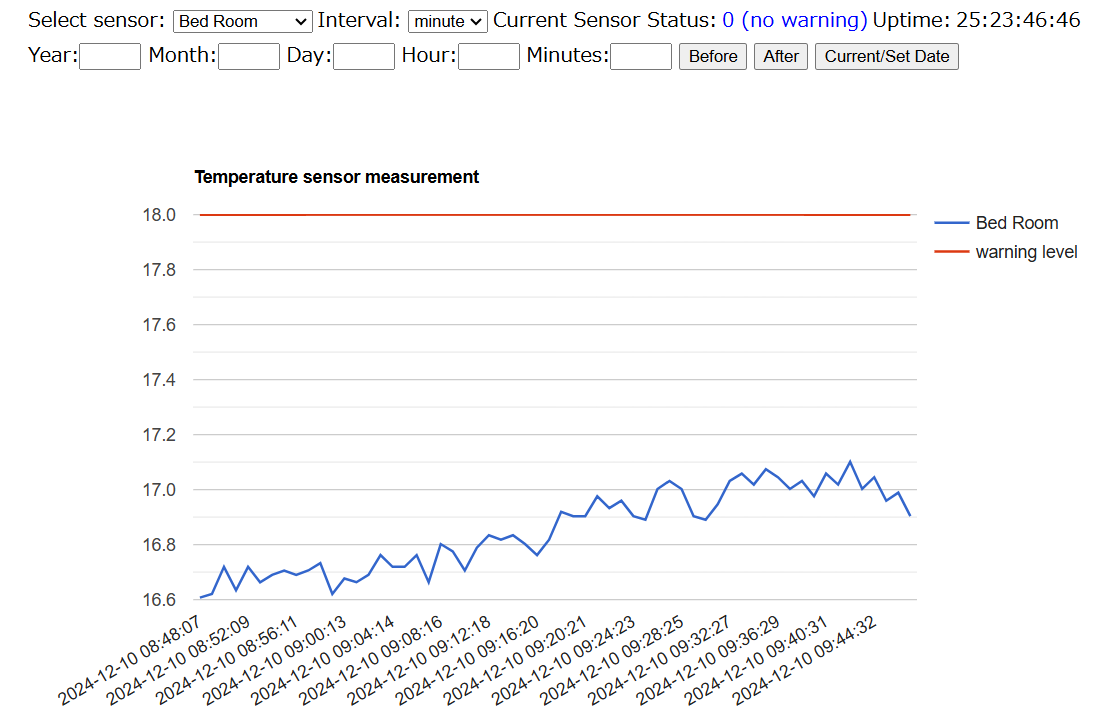
The usage of Google Charts varies greatly depending on the time, but I will introduce how to use it as of 2024/12/10.
<html>
    <head>
        <!-- The URL has changed -->
        <script src="https://www.gstatic.com/charts/loader.js"></script>
        <script>
            google.charts.load('current', {'packages': ['corechart']});
            google.charts.setOnLoadCallback(drawChart);
            current_room = '60';  // Room number

            function drawChart() {
                let temperature = [['time', toName(current_room)]]; // Convert room number to room name
                const lines = getData(current_room); // Read data from DB in the form of [ {<time>: <temperature>} ]
                for (const line in lines) {
                    temperature.splice(1, 0, [line[0], line[1]]);
                }
                const option_temp = {
                    "title": "Temperature",
                };
                const chart_temp = new google.visualization.LineChart(document.getElementById("temp_div"));
                const table_temp = new google.visualization.arrayToTable(temperature);
                chart_temp.draw(table_temp, option_temp);
            }
        </script>
    </head>
    <body>
        <div id="temp_div"></div>
    </body>
</html>
Conclusion
#In this article, we built a room temperature and humidity monitoring system using Raspberry Pi and TWELITE. TWELITE runs on two dry-cell batteries, and since it can cut power to everything except the timer when not in operation, theoretically, it can operate for more than half a year on AA batteries.
Recently, sensors capable of measuring pressure have appeared, so I'm fantasizing about possibilities like predicting the weather six hours ahead.