Quality Quantification and Reliability Growth Models | How Effective PMs Conduct Software Reliability Assessment and Quality Assurance
Back to TopTo reach a broader audience, this article has been translated from Japanese.
You can find the original version here.
Introduction
#When you hear “quality management,” you might think of “satisfying users” or “meeting specifications.”
Software engineering researcher Robert L. Glass points out that quality is not a single element. Quality is a collection of various attributes.
Quality assurance is the effort to manage these diverse attributes in a balanced manner. Among these, “reliability” is an important characteristic that determines whether users can continue to use the system with confidence.
In this article, we focus on “reliability,” one of the important elements that make up quality. We will explain how project managers can utilize software reliability growth models, which are widely used in quality assurance.
In his book 『Facts and Fallacies of Software Engineering(ソフトウェア開発 55の真実と10のウソ)』, Robert L. Glass defines quality as a “collection of attributes” and points out that it is distinct from other aspects such as user satisfaction, schedule, and cost.
What is Software Quality? The Eight Characteristics Defined by ISO/IEC 25010
#The international standard ISO/IEC 25010 classifies quality into the following eight attributes.
- Functional suitability
- Performance efficiency
- Compatibility
- Usability
- Reliability
- Security
- Maintainability
- Portability
Why Reliability is Emphasized in Quality Assurance
Among these, reliability refers to the ability of a product or system to continue operating stably under specified conditions. The frequency of failures, minimal impact when they occur, and rapid recovery ability are important elements for products and systems. The ability of the software in the product or system to continuously provide the expected functionality serves as an indicator of reliability.
Representative Metrics for Quantifying Software Reliability
#Representative metrics for quantifying reliability include MTTF and defect convergence rate.
What is MTTF?
#It refers to the average time to failure of a product or system. It takes its initials from “Mean Time To Failure,” hence MTTF.
It is a predictive value and does not guarantee that the product will operate until that time. It is used as a reference in reliability tests and is expressed by the following formula.
Formula for MTTF
Example Calculation
- Operating time of the product: 1000 hours
- Number of failures: 5
- MTTF = 1000 ÷ 5 = 200 hours
Meaning
It indicates that, on average, a failure occurs every 200 hours.
The longer the MTTF, the higher the reliability of the product or system.
How to Calculate Defect Convergence Rate and Key Usage Points
#The defect convergence rate is a metric that indicates the proportion of defects discovered and fixed during software development or testing. In the field of software quality management, it is used to quantitatively evaluate the progress of testing and reviews.
The defect convergence rate is calculated using the following formula.
Formula for Defect Convergence Rate
Key Points
By using the number of defects discovered during testing along with software reliability growth models, you can predict the estimated total number of defects. This allows you to scientifically evaluate the progress of defect convergence.
Proper Use of Software Reliability Growth Models | Key Points for Its Application as a Quality Assurance Method
#Software reliability growth models analyze the cumulative number of defects discovered during testing. They are a representative quality assurance method used to predict the number of latent defects.
They are widely employed in many quality assurance settings as a primary means of reliability assessment.
❌ Bad Example: Using Dates on the X-Axis (Incorrect Usage of Software Reliability Growth Models)
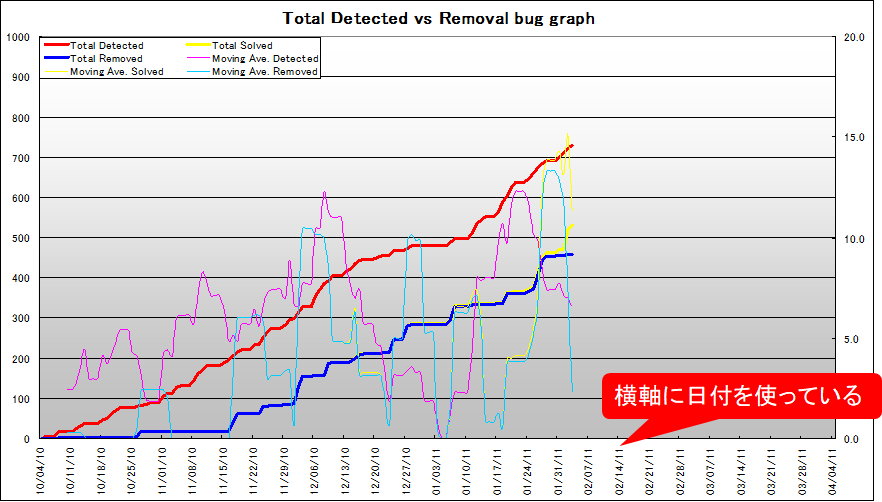
When dates are used on the X-axis, periods without testing are also included. As a result, the pace of defect detection becomes inaccurate, and the precision of reliability predictions decreases.
✅ Good Example: Using Test Time on the X-Axis (An Example of Properly Applying Software Reliability Growth Models for Reliability Assessment)
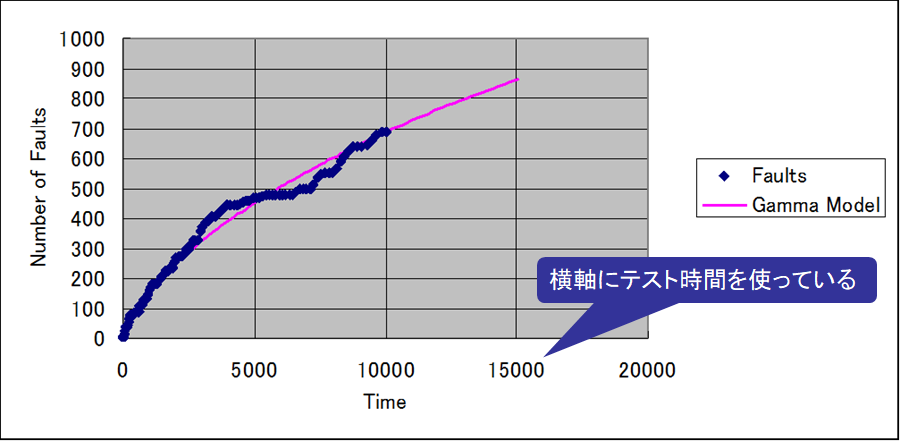
It is important to correctly apply software reliability growth models. Incorrect usage can significantly impact the accuracy of reliability assessments in quality assurance.
Practical Reliability Assessment Using SRATS | How to Leverage Software Reliability Growth Models
#I often use a tool called SRATS for reliability growth curves.
SRATS (Software Reliability Assessment Tool on Spreadsheet Software) is a quality assurance method that allows software reliability growth models to be handled within spreadsheet software. It supports software reliability assessment and test progress management by utilizing reliability growth curves.
Overview of SRATS2017
#It evaluates software reliability – the degree of stability required for software to function correctly – based on probability and statistical theory.
- Input: Fault data
- Time Interval or Cumulative Time
- Number of Failures
- Output: Software reliability growth model
- Predictive Residual Faults: Number of remaining defects at the current point
- Fault-Free Probability: Probability that all defects have been removed at the current point
- Conditional MTTF: Test time until the next defect is discovered
Example Use of SRATS2017
#Fault Data Input (Time Interval and Cumulative Time)
#First, prepare the fault data from test results.
The number of defects should be created from defect data registered in issue tracking systems such as Redmine or JIRA. Count based on the number of reported incidents.
There are two methods for data input: “Time Interval” or “Cumulative Time.” The unit of time can be person-hours, person-days, etc., as long as it is consistent within the project. The important point is to measure continuously using the same unit.
Example: Time Interval
| Test Date | Time Interval (hours) | Number of Failures |
|---|---|---|
| 2024-01-01 | 24 | 3 |
| 2024-01-02 | 24 | 3 |
| 2024-01-03 | 24 | 3 |
| 2024-01-04 | 24 | 3 |
In this example, three people conducted 8 hours of testing each day, and 3 defects were found per day.
Example: Cumulative Time
| Test Date | Cumulative Time (hours) | Number of Failures |
|---|---|---|
| 2024-01-01 | 24 | 3 |
| 2024-01-02 | 48 | 3 |
| 2024-01-03 | 72 | 3 |
| 2024-01-04 | 96 | 3 |
In the case of cumulative time, the difference from “Time Interval” is that the second column is a running total. Although the unit of time is in person-hours here, person-days or person-months are also acceptable.
Model Selection and Parameter Estimation (Evaluation Using AIC/BIC)
#Next, estimate the model. Select the cells of the fault data and run “Estimate.”
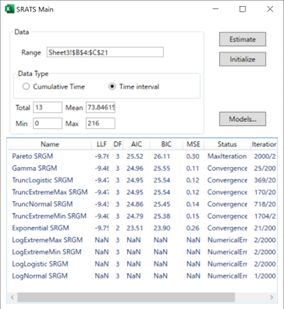
After estimating the model, a summary of the estimation results (such as Gamma SRGM, Exponential SRGM, etc.) will be displayed.
If the Status is “Convergence,” it means that the parameters that best fit the data have been estimated. On the other hand, “MaxIteration” indicates that parameter estimation has not been performed properly.
The model with the lower AIC or BIC in the estimation summary is the one that best fits the fault data.
How to Read the Reliability Report (Predictive Residual Faults, Fault-Free Probability, Conditional MTTF)
#After selecting the fitted model, output the report to evaluate reliability. The results serve as decision-making material when operating software reliability growth models as a quality assurance method.
Example: Software Reliability Growth Model
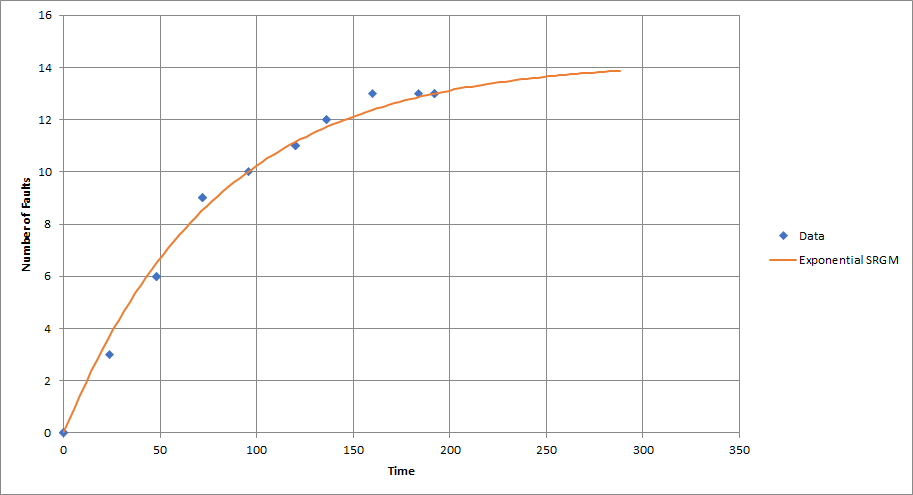
If the curve is close to horizontal, it indicates high reliability.
Example: Fault Prediction
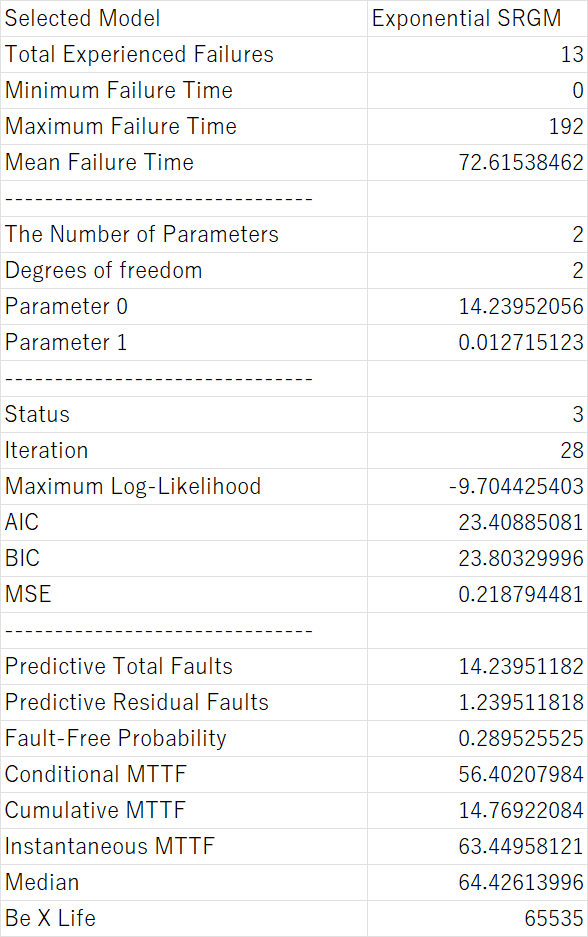
- Predictive Residual Faults
In this example, it means that there are 1.2395 defects remaining at this point. - Fault-Free Probability
It means that the probability that all defects have been removed at this point is 0.2895. - Conditional MTTF
It means that if the next defect is to be discovered, it will be after 56.40 units of test time.
Quality assurance staff use these metrics to determine whether additional testing is necessary.
Interpreting Software Reliability Growth Models
#Here is an example of determining whether defects have converged based on a software reliability growth model (SRGM).
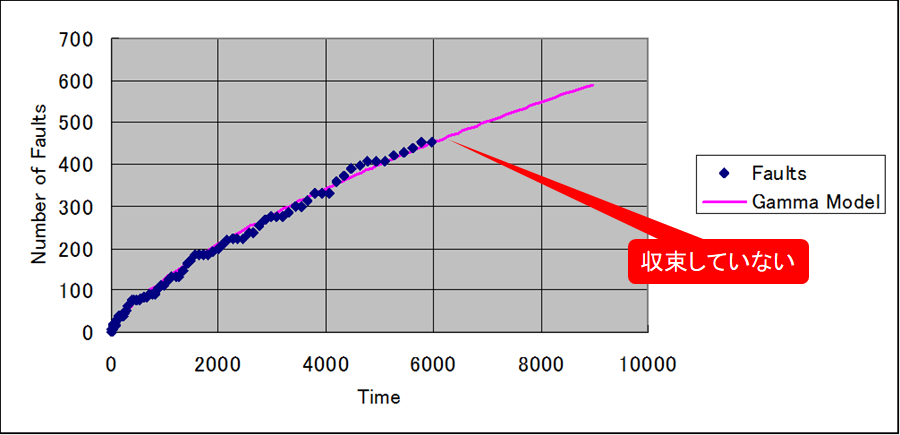
Since the SRGM has a steep upward shape, you can determine that many defects are latent in the early testing stage.
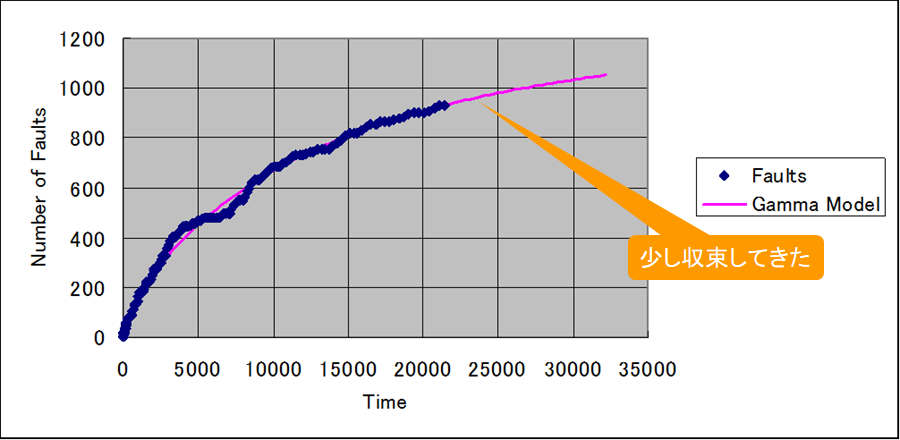
When the slope of the SRGM starts to flatten, you can determine that although defects are decreasing, there are still latent ones.
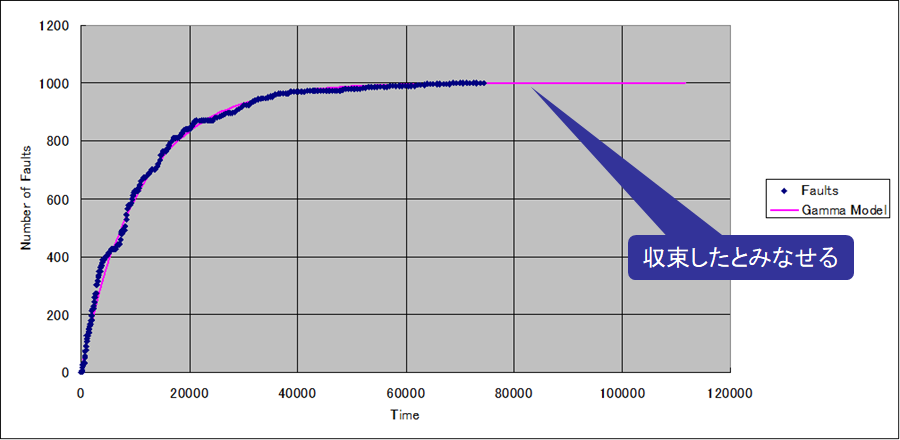
When the slope of the SRGM approaches horizontal, it means that it takes longer to find new defects, and you can determine that convergence has been reached.
Conclusion: SRGMs Are Nothing More Than a "Powerful Part" of Quality Management
#Software reliability growth models are a powerful tool to quantitatively back up reliability assessments. However, they are not the entirety of quality management.
Robert L. Glass stated that "quality is a collection of attributes." Software reliability growth models are merely a method to quantify "reliability" among the various attributes of quality assurance.
To succeed in quality assurance, it is necessary to consider not only reliability but also performance, maintainability, security, and so on. Let us leverage software reliability growth models as part of overall quality assurance to improve the quality of the entire project.
This article is part of the Effective PM Series
👉 Preventing Checklists from Becoming Mere Formalities | Reconstruction Techniques and 7 Improvement Measures for Effective PMs
👉 How to Run Recurring Meetings That Don’t Become Mere Formalities | 7 Improvement Steps for Effective PMs
👉 Operating Issue Lists to Ensure Issues Are Resolved | 12 Techniques for Effective PMs to Break Away from Formalities
👉 Problem-Solving Techniques Using Cause-and-Effect Diagrams | Practical Steps for Effective PMs to Improve On-Site Operations
👉 Driving Workplace Action with Intermediate Goals in Future Reality Trees | Improvement Planning Techniques for Effective PMs
👉 Practical Steps for Process Improvement | The IDEAL Model and Secrets to Success Used by Effective PMs
👉 Success Guide for Change Management | Requirements Management, Configuration Management, and Traceability Practices for Effective PMs