Anomaly Detection with Image AI: Model Selection and Practical Implementation
Back to TopTo reach a broader audience, this article has been translated from Japanese.
You can find the original version here.
The technology of image AI is rapidly evolving and is being utilized in various tasks such as anomaly detection, object detection, and segmentation. This article describes the characteristics and selection criteria of models that can be used for anomaly detection, as well as the results of actually training an AI for anomaly detection using open data.
Models Available for Anomaly Detection
#When you want to perform anomaly detection with image AI, you need to select a model to use for training. Models that can be used for anomaly detection include anomaly detection models, object detection models, segmentation models, and classification models. Here we summarize the features, advantages, and disadvantages of each.
Anomaly Detection Models
#Features: Mainly uses only normal data for training. It learns normal patterns and detects data that deviates from them as anomalies.
Advantages:
- Can be trained with only normal data as it detects deviations from normal patterns.
- Can start training immediately without annotation.
- Applicable to various data such as time-series data, image data, and network traffic.
Disadvantages:
- Generally said to have lower accuracy in cases of misalignment or complex backgrounds.
Object Detection Models
#Features: Surrounds specific areas in an image with bounding boxes and captures the characteristics of those areas. The data used for training needs to be annotated (labeled) with bounding boxes.
Advantages:
- Can identify abnormal areas by surrounding them with bounding boxes.
- Abundant real-time detection models.
Disadvantages:
- Requires annotation (labeling) of abnormal areas, which is labor-intensive and time-consuming as it is usually done manually.
Segmentation Models
#Features: Classifies data at the pixel level, identifying abnormal areas. It is possible to precisely identify abnormal areas in image data. The data used for training needs to be annotated along the contours of the objects to be detected.
Advantages:
- Can precisely identify abnormal areas at the pixel level, enabling precise anomaly detection in image data.
Disadvantages:
- High computational cost and requires a lot of resources due to pixel-level data classification.
- High annotation cost, requiring a lot of effort and time to prepare training data.
Classification Models
#Features: Uses both normal and abnormal data for training in supervised learning. Classifies and detects anomalies as specific classes.
Advantages:
- Can detect anomalies with high accuracy if both normal and abnormal data are available.
- Can identify multiple types of anomalies.
Disadvantages:
- Requires abnormal data in the same amount as normal data for training.
- Difficult to detect patterns of anomalies that have not been trained, requiring comprehensive collection of abnormal data.
Criteria for Model Selection
#Considering the characteristics of each model mentioned above, the following points are considered when selecting a model for actual anomaly detection.
-
Check SOTA (State-of-the-Art) Models
Compare the performance by checking the latest research and proven models. -
Need for Real-Time Inference
Determine whether real-time anomaly detection is necessary. If real-time inference is required, a model with fast processing is needed. -
Resources for Training the Model
Consider available GPUs or cloud resources and select a model according to the case. Check both the resources available during training and the resources expected during operation. -
Need for Identifying Anomaly Locations
If it is necessary to identify the location of anomalies, it is necessary to use anomaly detection models with heatmaps, object detection models with bounding boxes, or segmentation for inference. In this case, classification models are not suitable.
In selecting an AI model, the following points are also important.
- Availability of Ready-to-Use Code
Implementing a model from scratch is rare, and it is common to use existing frameworks or libraries. Having ready-to-use code can reduce development costs and time.
Trying Out Anomaly Detection
#So far, we have discussed how to choose a model, but now we will compare the training results using the anomaly detection model Patchcore and the object detection model RTMdet with open data. Both models are suitable for real-time inference.
The data used is the screw dataset from MVTec.
The screw dataset includes normal images and five types of abnormal images.
For this experiment, we will use the good (normal) data and scratch_neck (one of the five types of anomalies).
Creating the Dataset
#The MVTec screw dataset originally has no misalignment, constant brightness, and a constant background.
However, in actual sites where anomaly detection is desired, such good conditions are often not available.
Therefore, we created four patterns of datasets focusing on the following three elements.
- Misalignment: Whether the screw is in the center of the image or not
- Brightness: Whether the brightness and contrast of the image are constant or not
- Background: Whether the background is constant or not (in the non-constant condition, colorful squares are drawn randomly in the background)
Four Dataset Patterns
- No Misalignment, Constant Brightness, Constant Background
- Misalignment, Constant Brightness, Constant Background
- No Misalignment, Changed Brightness, Constant Background
- No Misalignment, Constant Brightness, Changed Background
Number of Images in Each Dataset
#For the anomaly detection model, only normal data is used for training, and for the object detection model, only abnormal data is used for training.
For the anomaly detection model
Training: 20 normal images
Testing: 5 normal images, 5 abnormal images
For the object detection model
Training: 20 annotated abnormal images
Testing: 5 normal images, 5 abnormal images
Evaluation Method of Trained Models
#The trained models are compared using AUC (area under the curve) and precision when recall is set to 1.
Although detailed explanation is omitted, recall is an indicator of missed anomalies, with recall=1 meaning no misses, and 0.9 meaning 10% misses. By comparing the precision when recall is set to 1, we can see how much the inference was correct under the condition of no misses.
AUC is the area under the ROC curve, taking values from 0 to 1, with values closer to 1 indicating a better model, and 0.5 indicating random inference.
Training and Evaluation of Anomaly Detection Model (Patchcore)
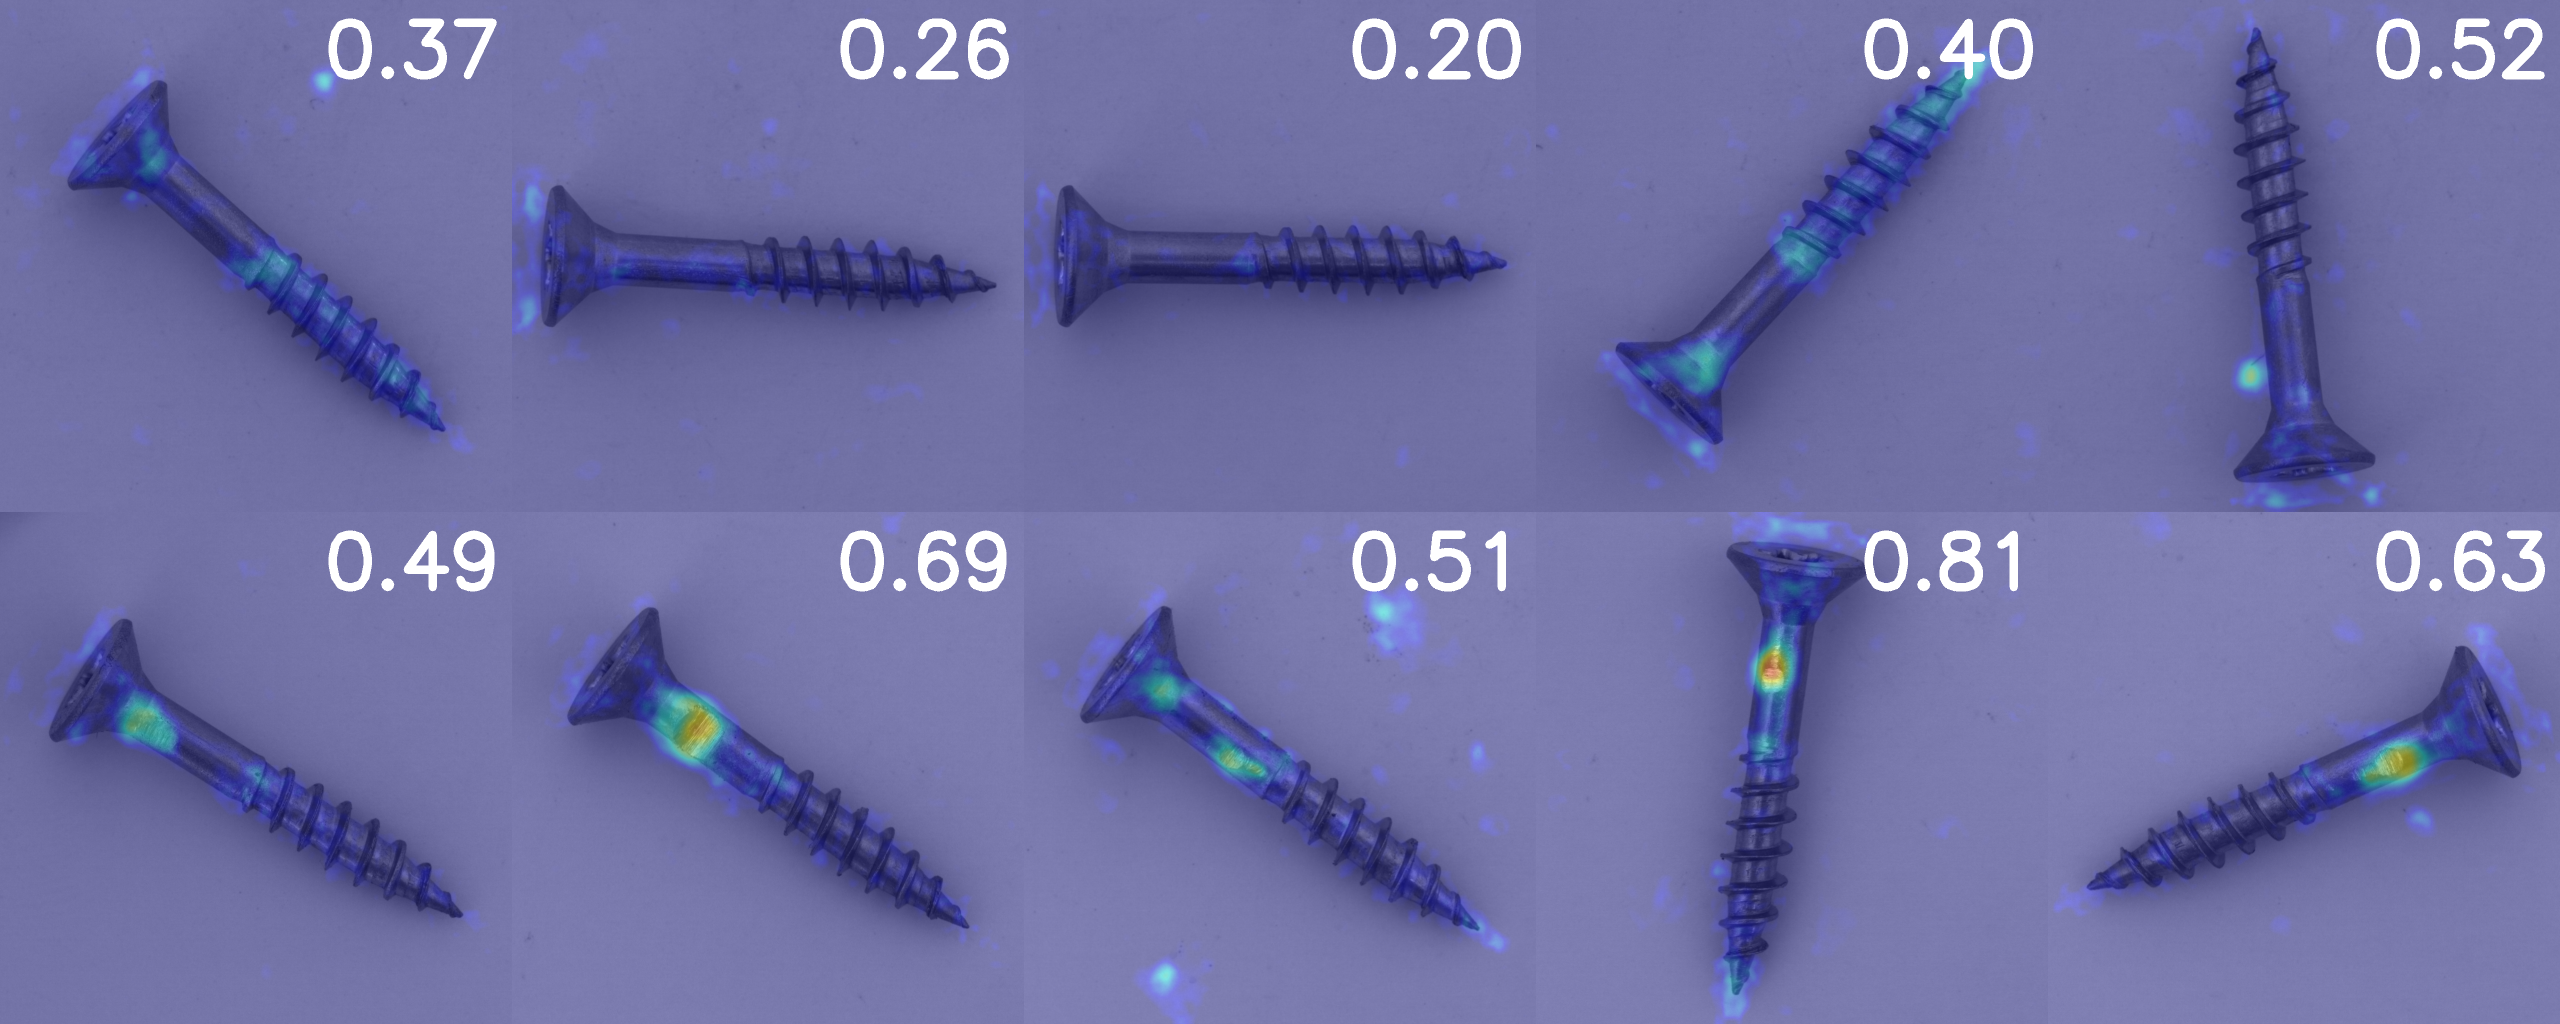
#The test data consists of 5 normal images in the upper row and 5 abnormal images in the lower row.
In Patchcore, a heatmap is output, with warmer colors indicating areas with a higher likelihood of anomalies.
Although it is possible to detect anomaly locations using the heatmap, this time only the determination of normal or abnormal for each image is used for accuracy calculation.
- No Misalignment, Constant Brightness, Constant Background
The MVTec data is used as is. Although the training data is only 20 images, it seems to capture the abnormal areas.
Setting the threshold to 0.49 makes recall=1.
At this time, precision: 0.83, AUC: 0.92, making it a very good model.
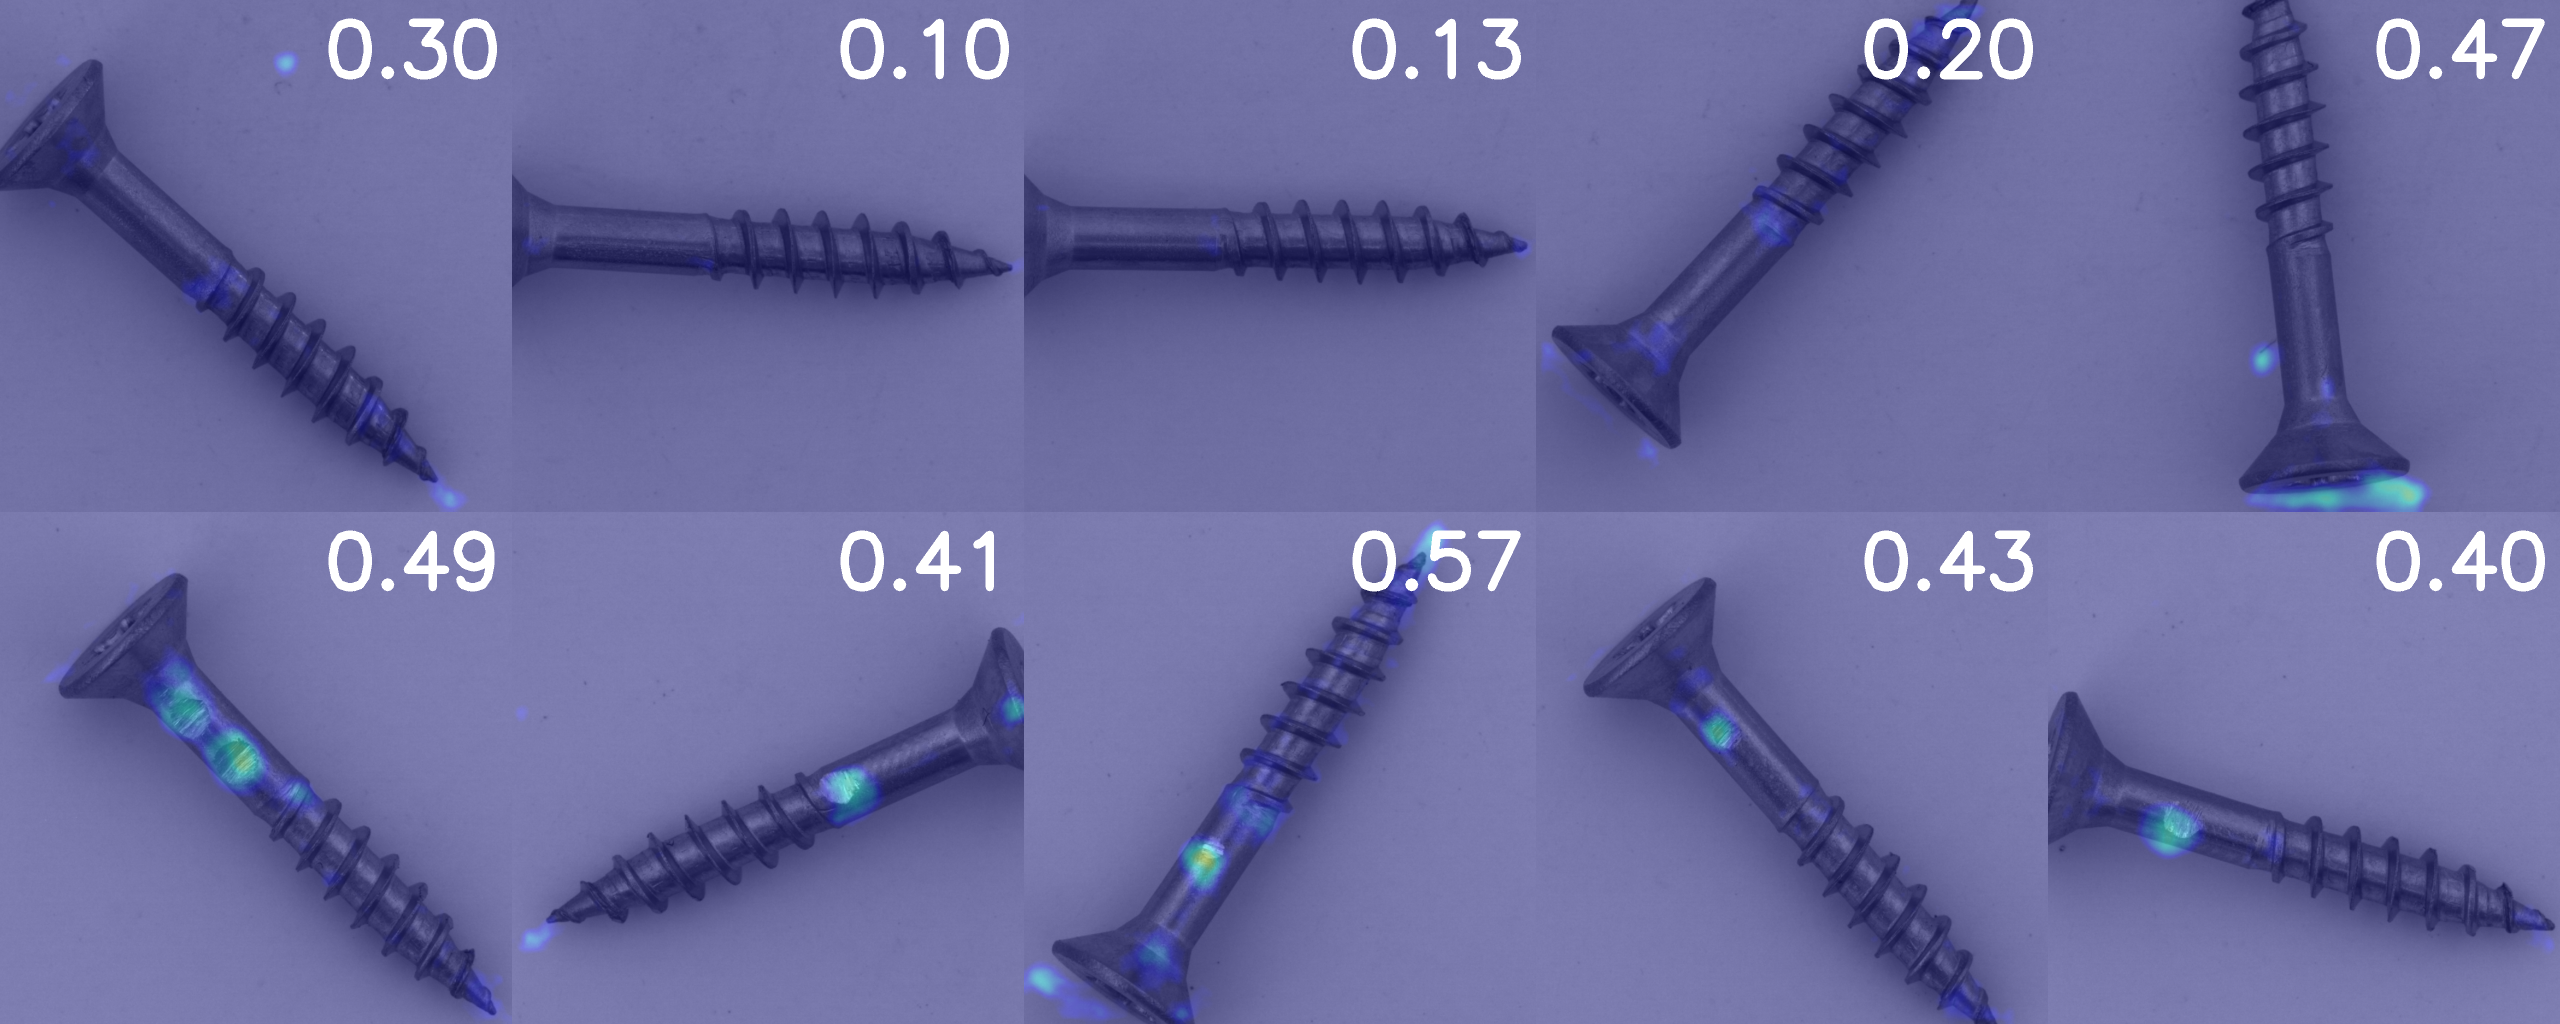
- Misalignment, Constant Brightness, Constant Background
Random cropping is performed to shift from the center, and then resized to the original size.
Setting the threshold to 0.40 makes recall=1.
At this time, precision: 0.83, AUC: 0.88.
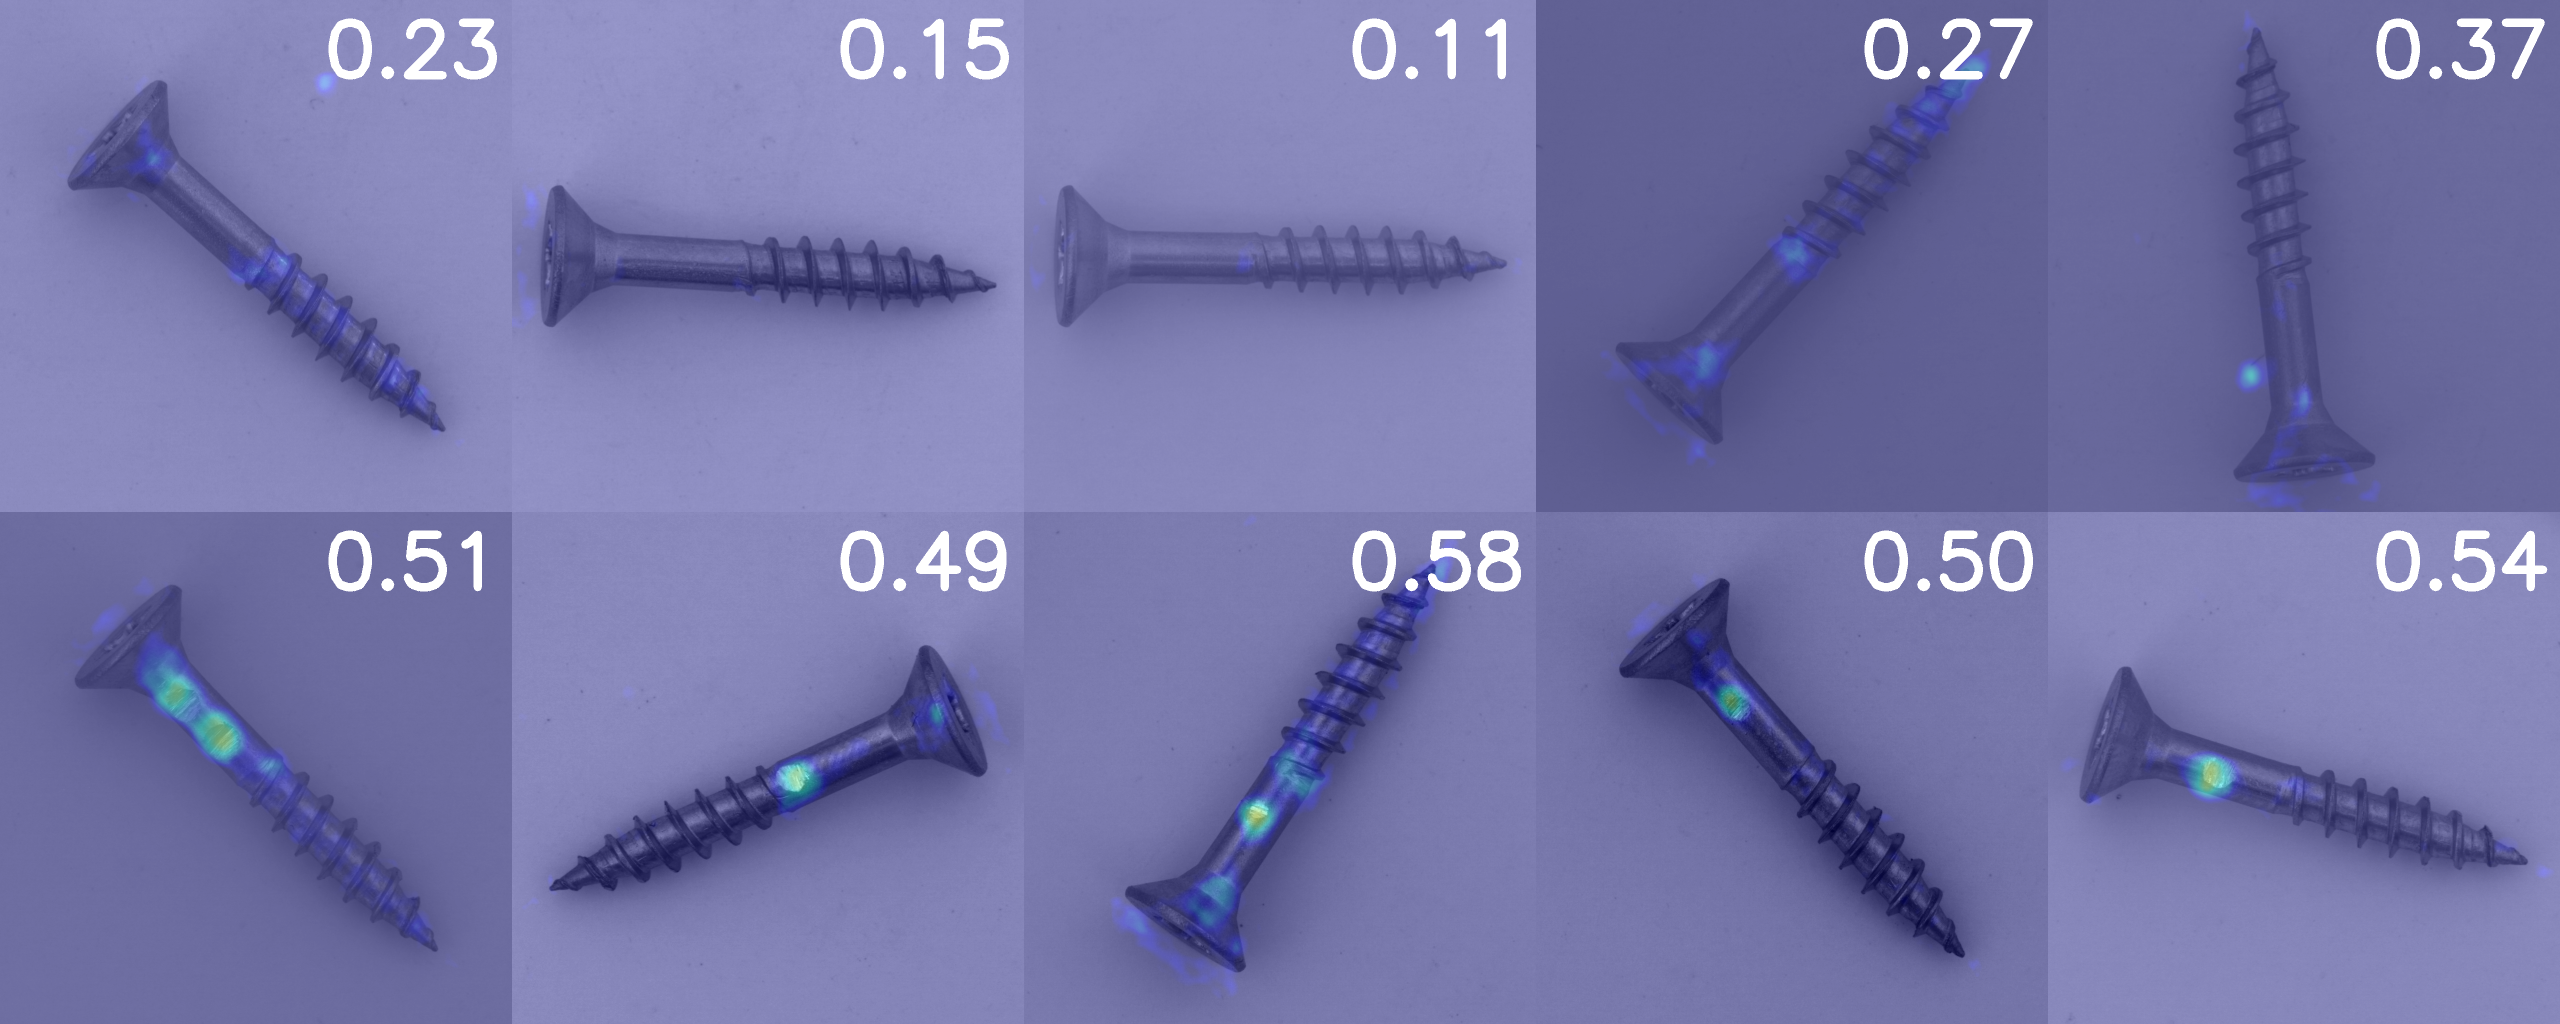
- No Misalignment, Changed Brightness, Constant Background
Brightness and contrast are randomly changed.
Setting the threshold to 0.49 makes recall=1.
At this time, precision: 1.0, AUC: 1.0, resulting in even better results than using the original unprocessed data.
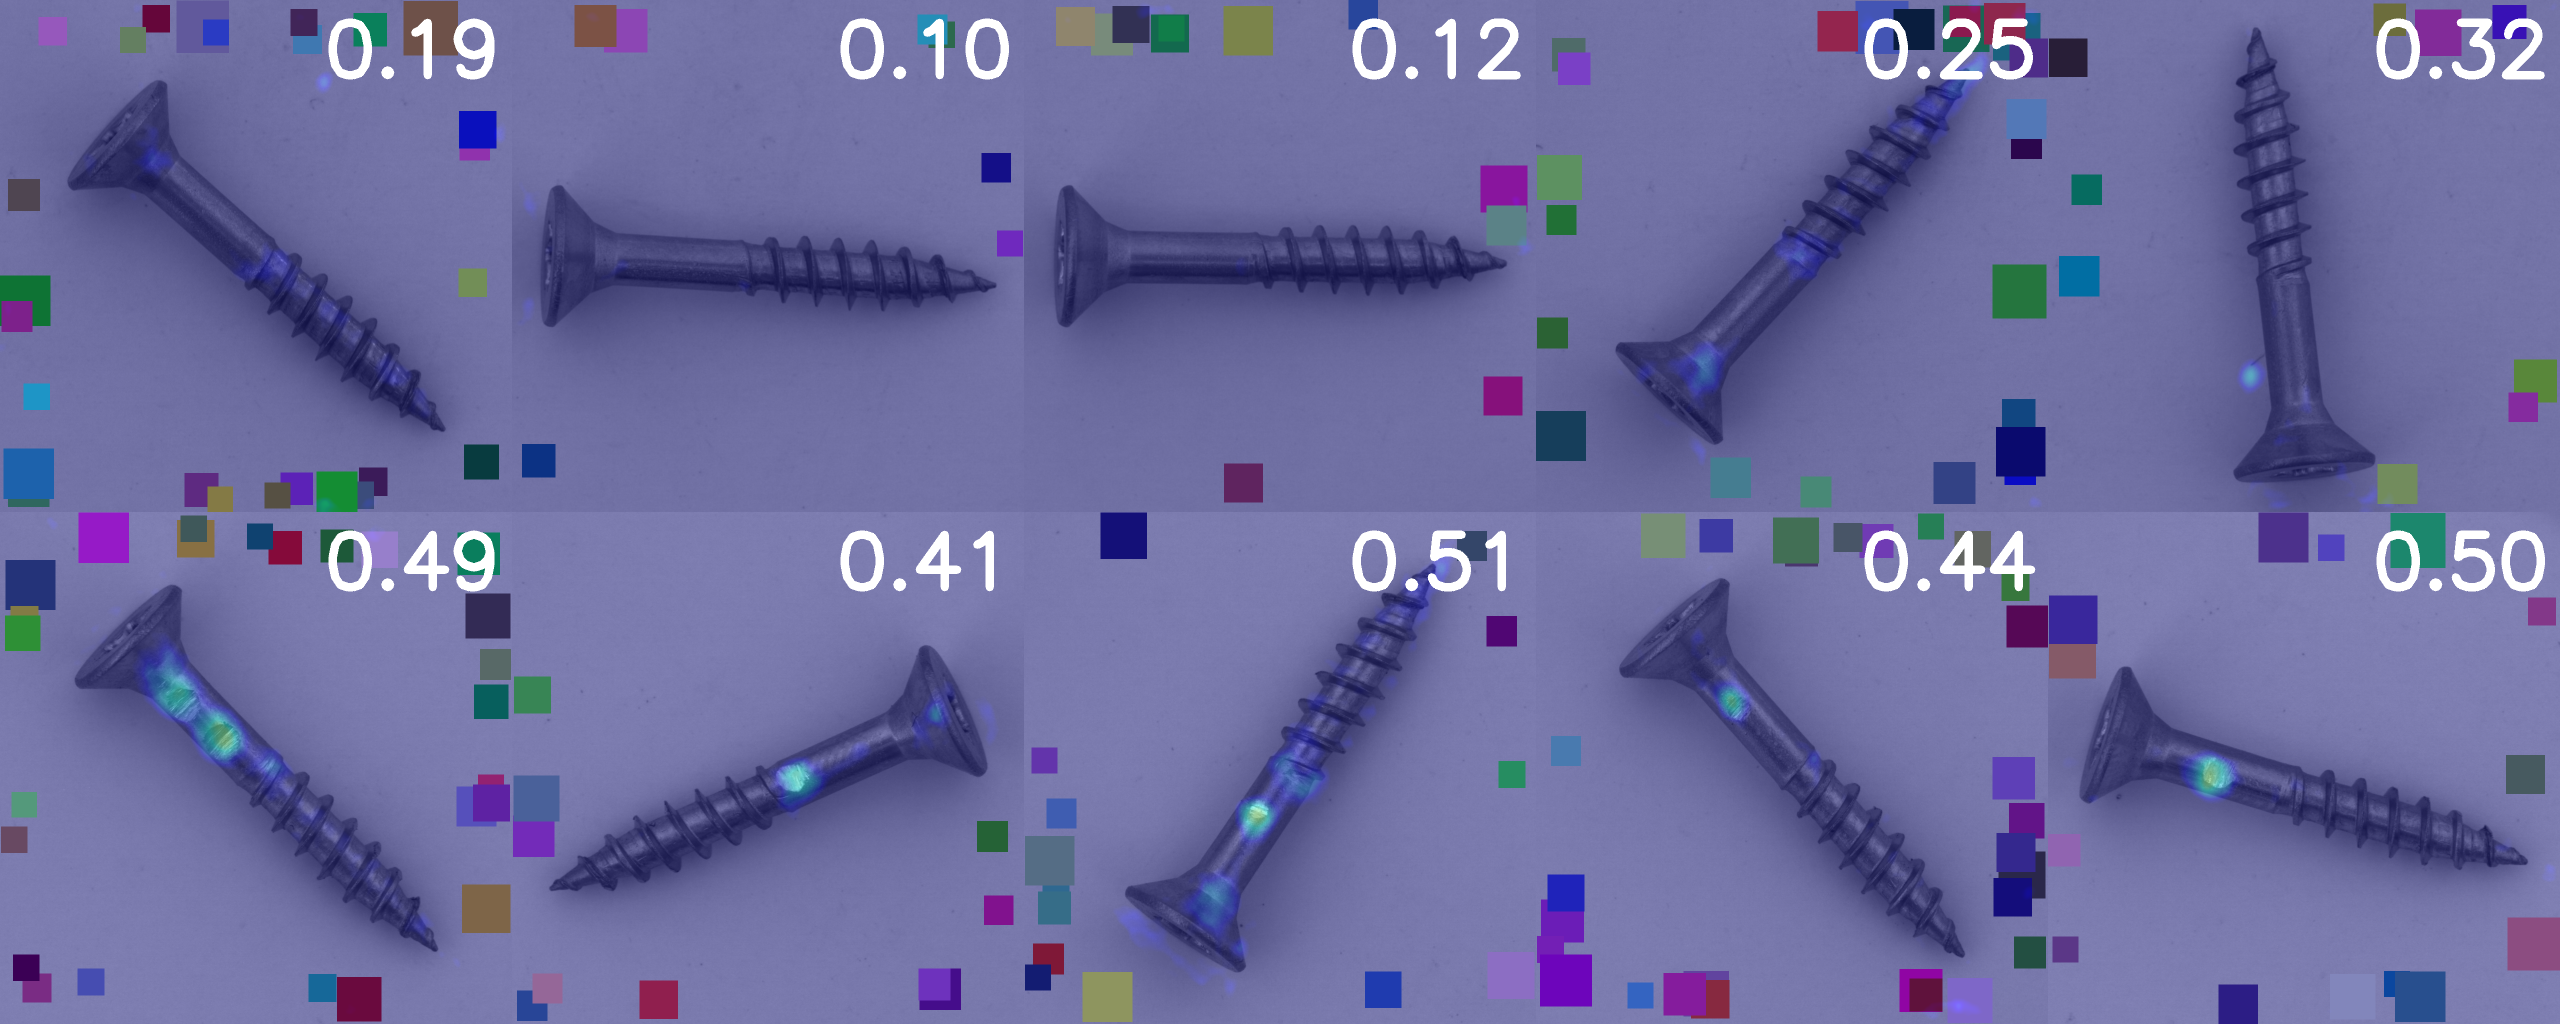
- No Misalignment, Constant Brightness, Changed Background
To add variety to the background, colorful squares are drawn randomly.
Setting the threshold to 0.41 makes recall=1.
At this time, precision: 1.0, AUC: 1.0, again resulting in better results than using the original unprocessed data.
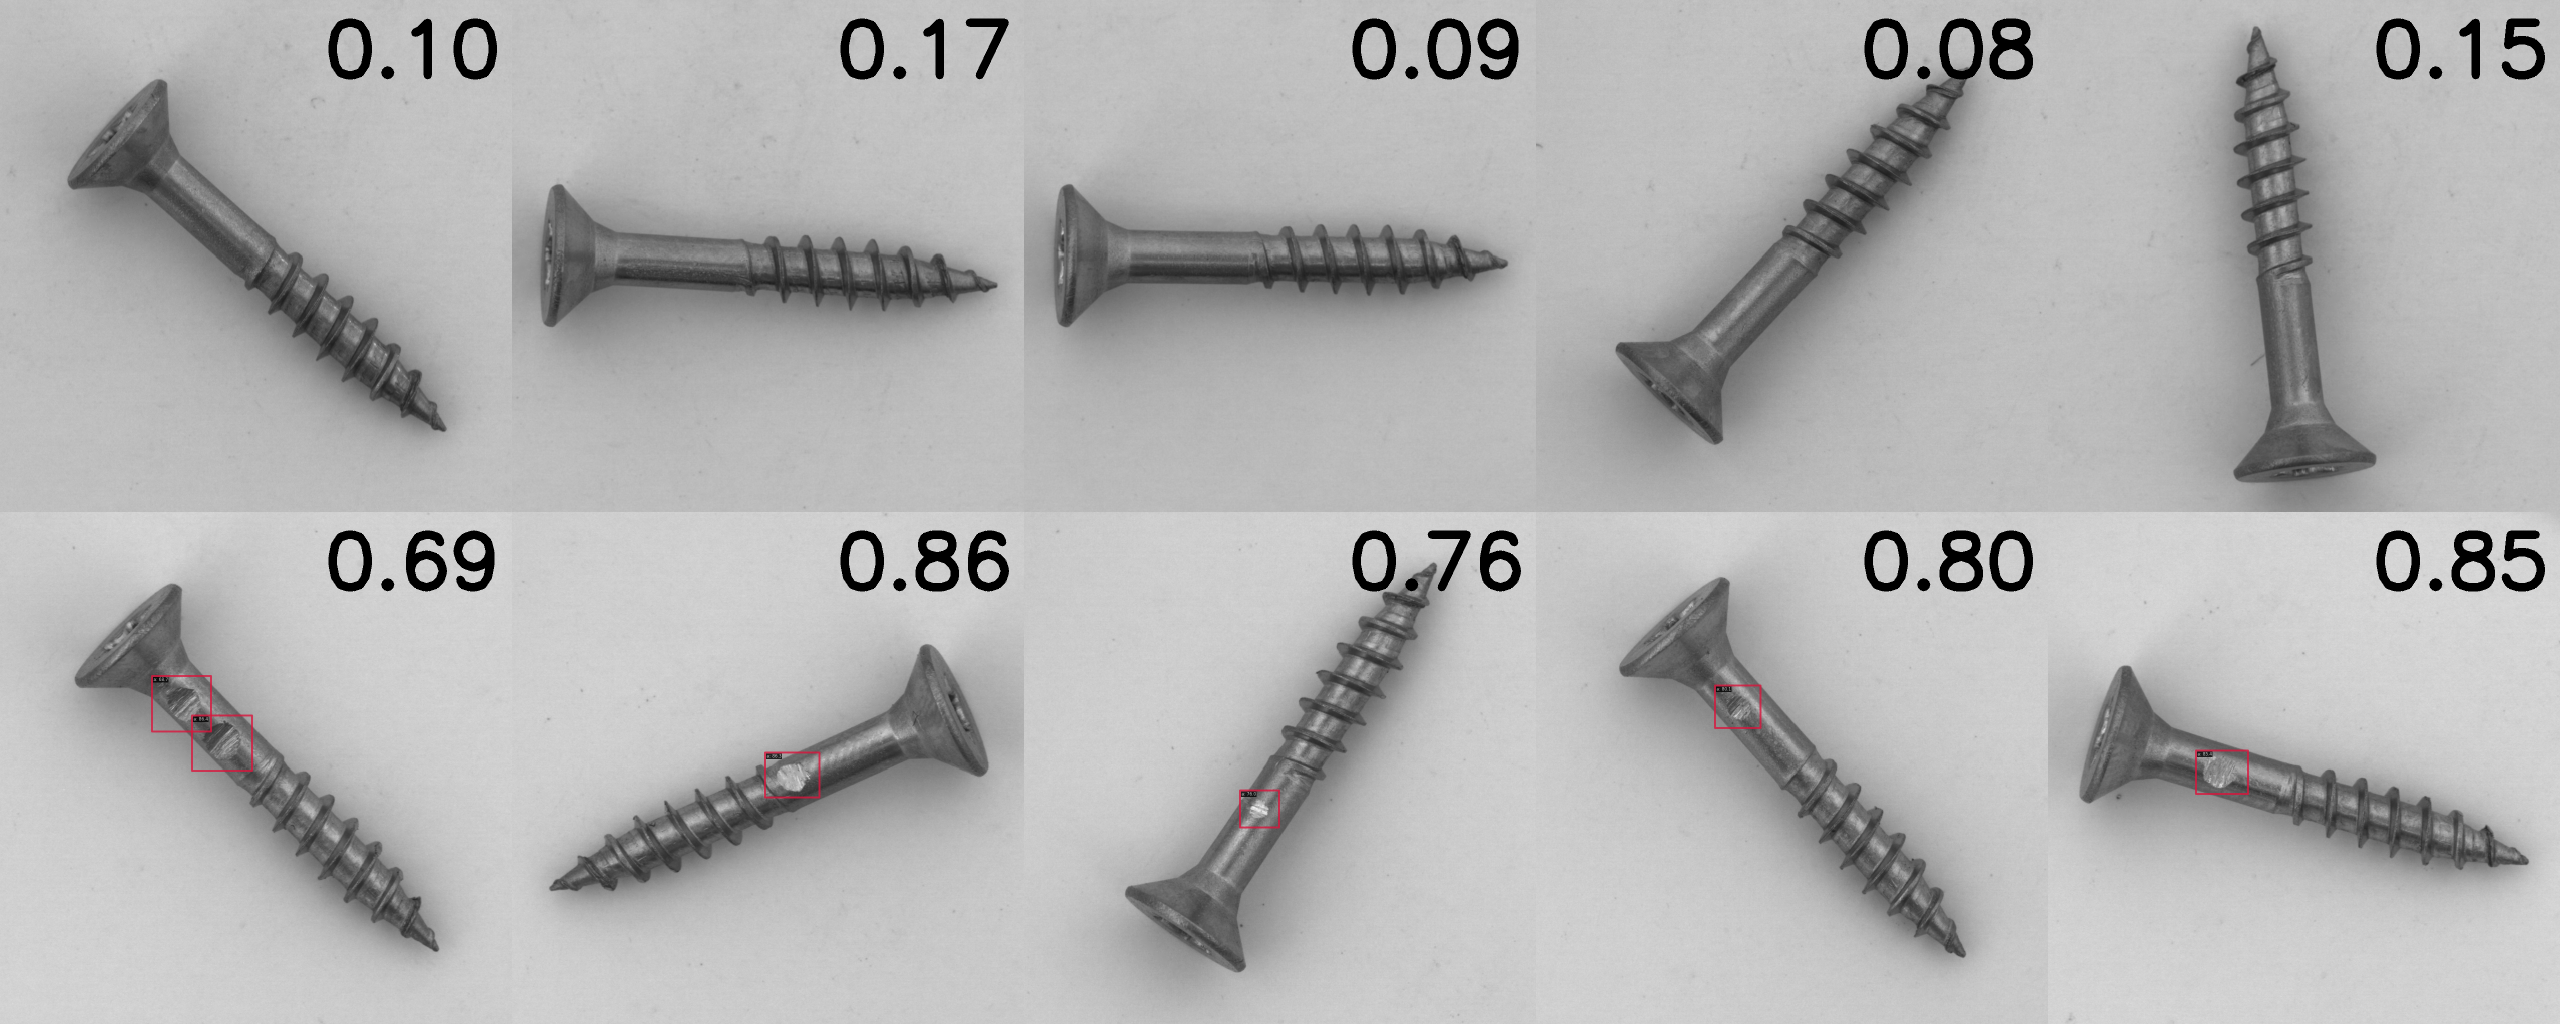
Training and Evaluation of Object Detection Model (RTMdet)
#The test data consists of 5 normal images in the upper row and 5 abnormal images in the lower row, similar to the anomaly detection model.
In RTMdet, a confidence score (0-1, with 1 being more abnormal) and associated bounding boxes are output during inference. This time, the threshold was set to 0.5. If there is a score greater than 0.5, the minimum value among them (the most normal-like value among the abnormal parts) is displayed in the upper right, and if there are only values of 0.5 or less, the maximum value (the most abnormal-like value among the normal parts) is displayed.
To compare with Patchcore, the accuracy calculation only uses the determination of normal or abnormal for each image, without considering the exactness of the abnormal areas.
- No Misalignment, Constant Brightness, Constant Background
Setting the threshold to 0.5 makes recall=1.
At this time, precision: 1.0, AUC: 1.0, indicating that it captures the abnormal areas well.
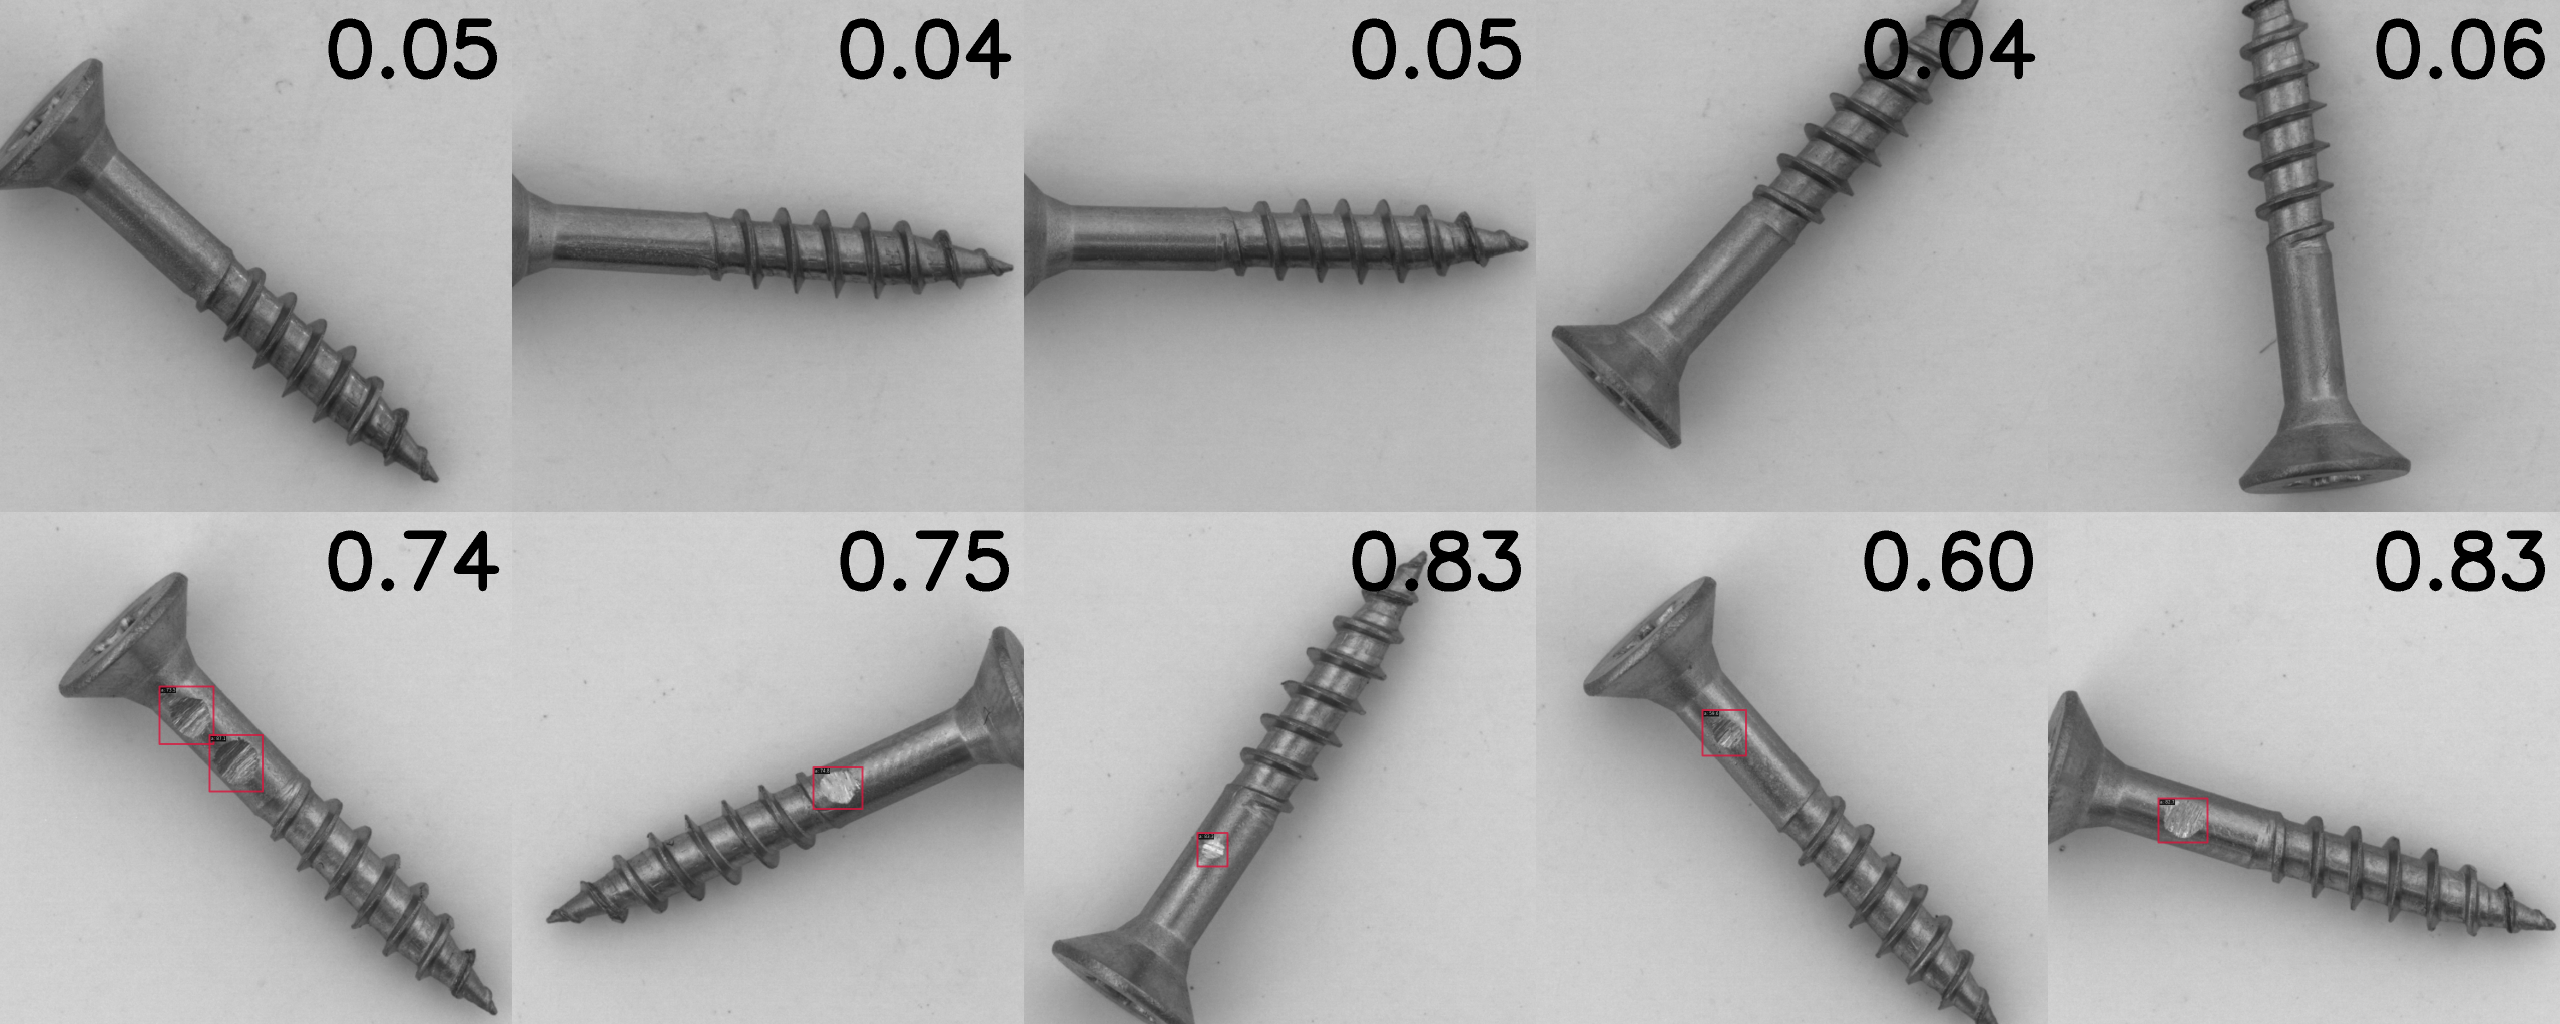
- Misalignment, Constant Brightness, Constant Background
Setting the threshold to 0.5 makes recall=1.
At this time, precision: 1.0, AUC: 1.0, indicating that misalignment has almost no effect.
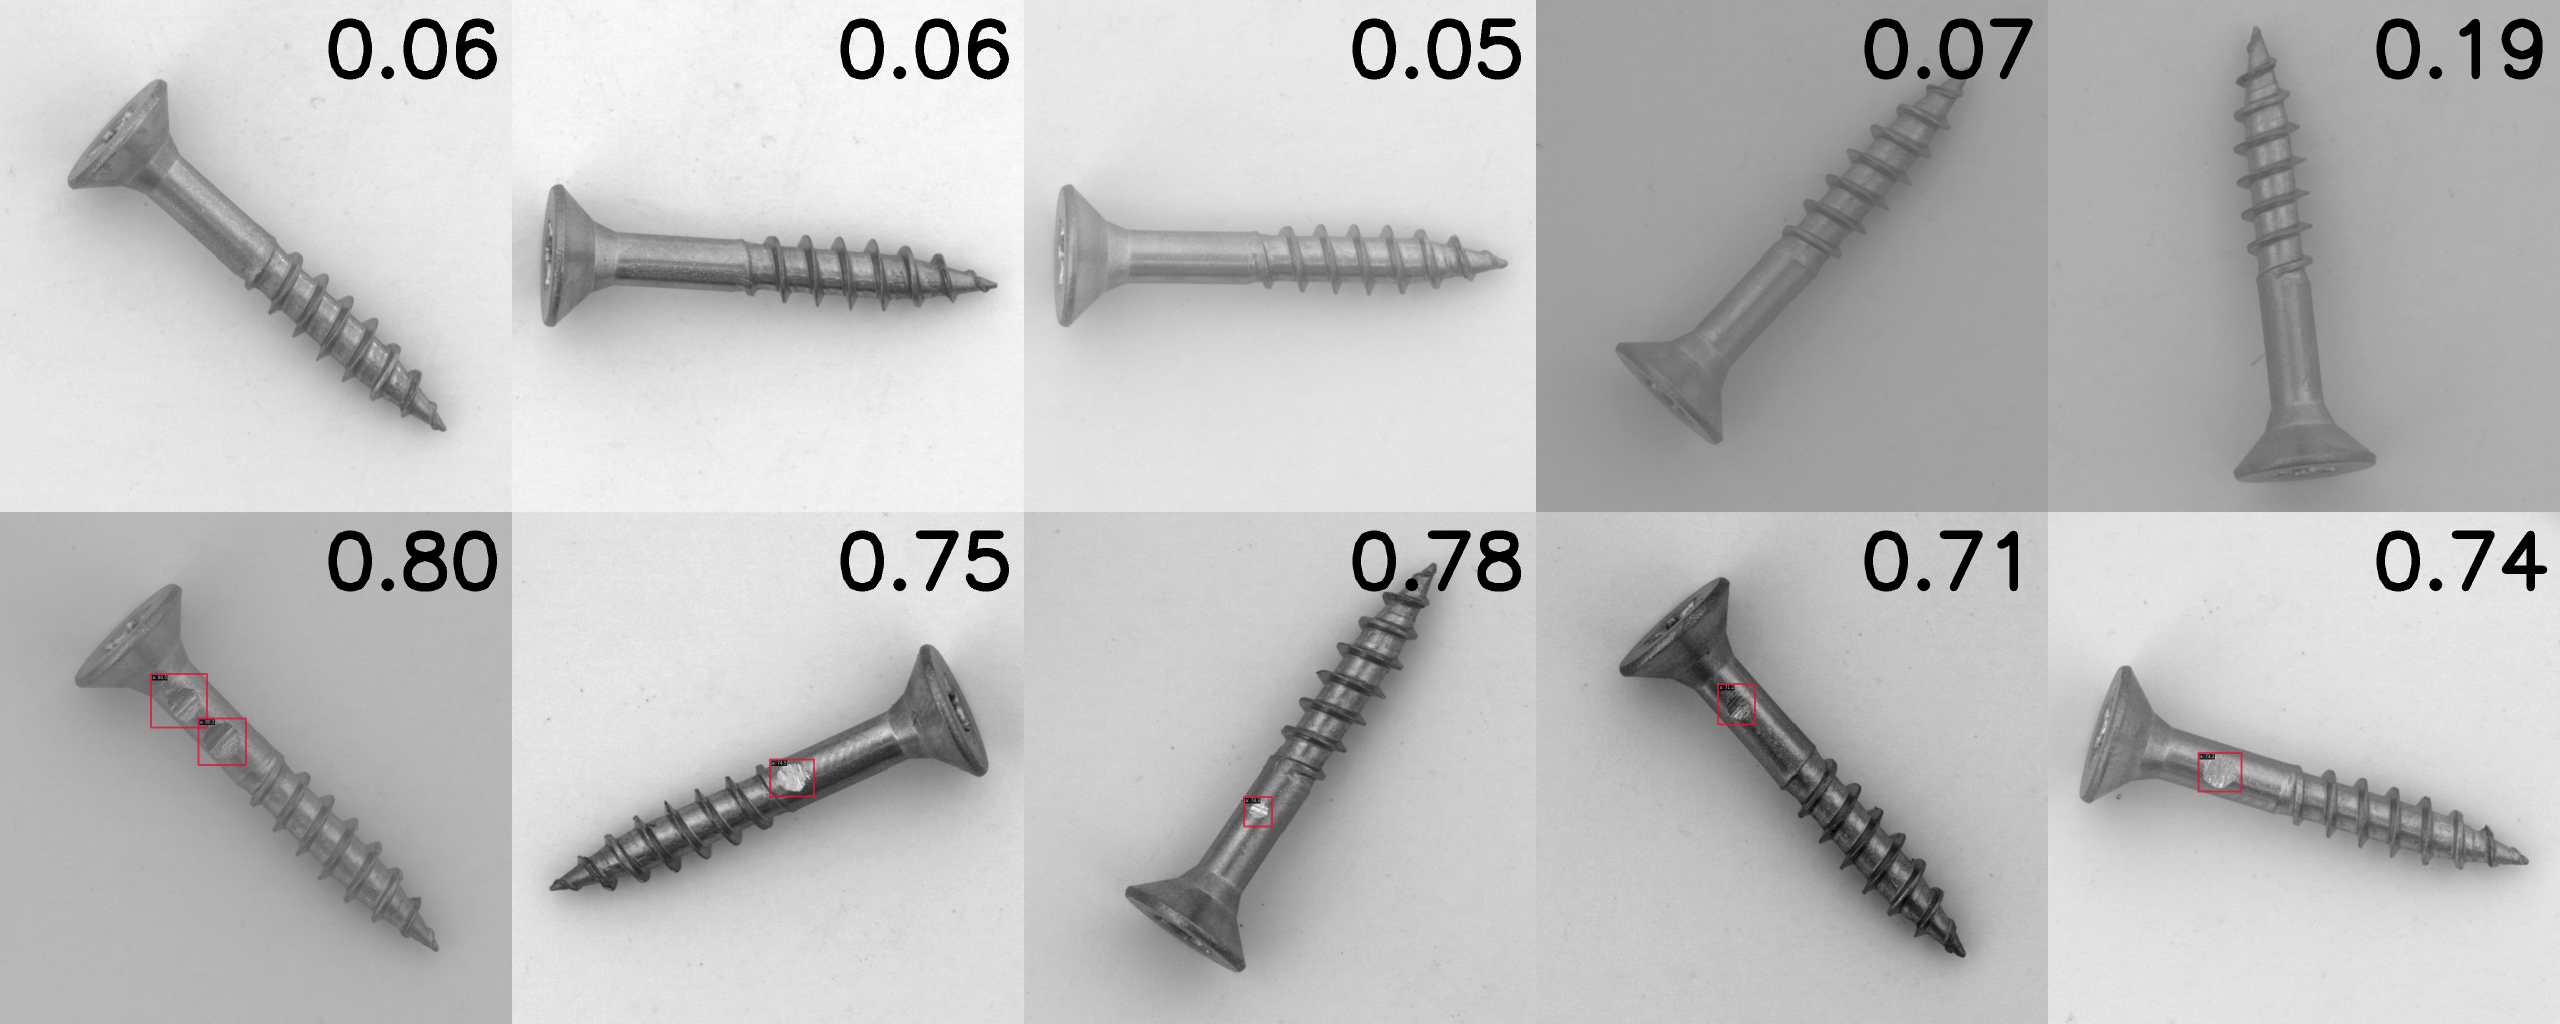
- No Misalignment, Changed Brightness, Constant Background
Setting the threshold to 0.5 makes recall=1.
At this time, precision: 1.0, AUC: 1.0, indicating robustness to changes in brightness.
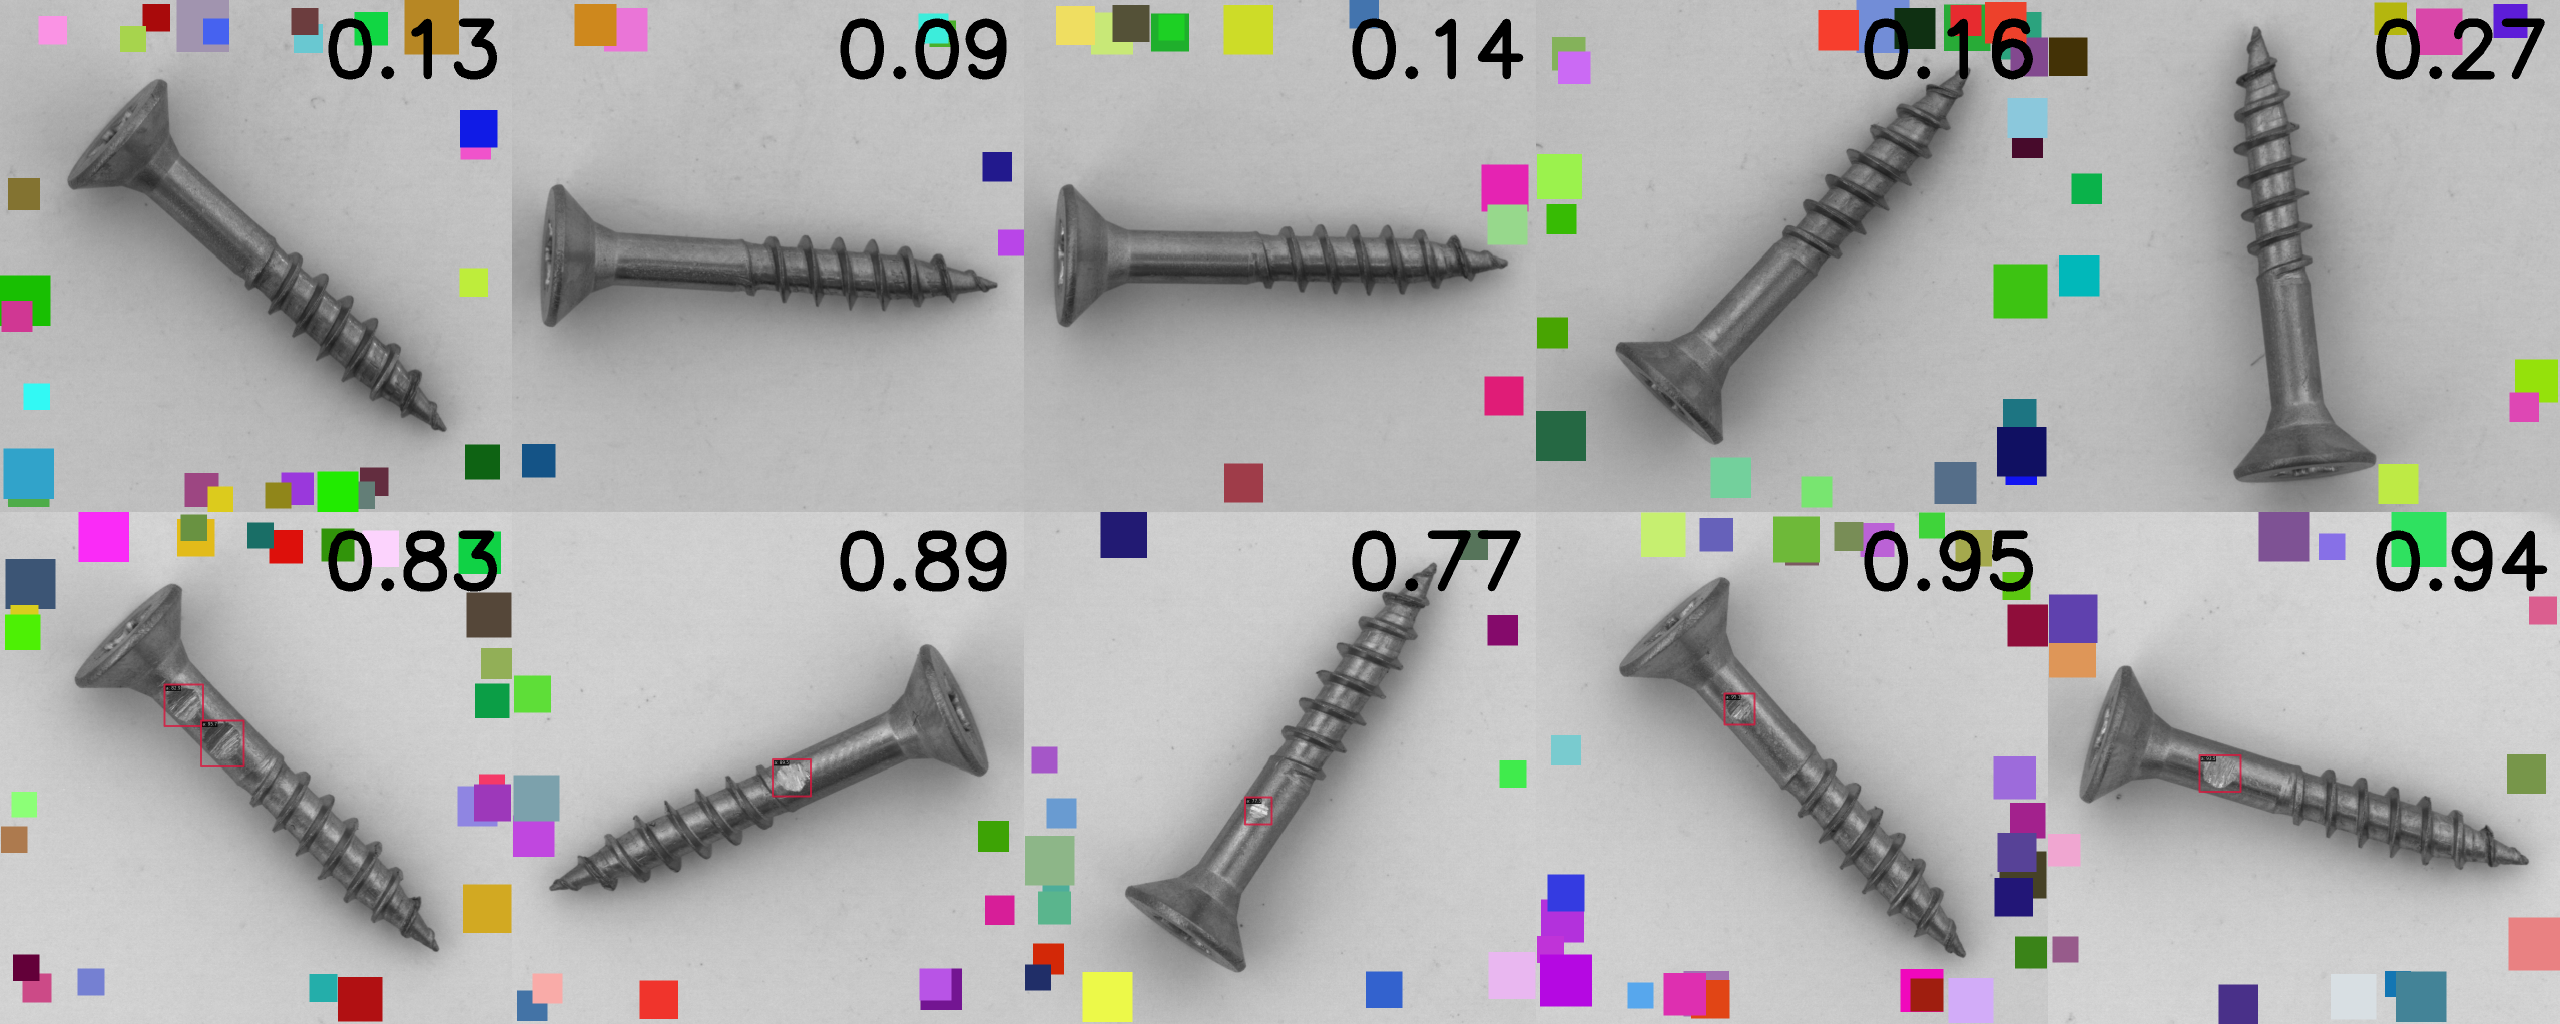
- No Misalignment, Constant Brightness, Changed Background
Setting the threshold to 0.5 makes recall=1.
At this time, precision: 1.0, AUC: 1.0, indicating that background changes have almost no effect.
Summary of Practical Implementation
#- Although it was expected that the anomaly detection model would be weak to changes in brightness and background, Patchcore did not show worse inference results.
- The object detection model showed almost no effect on learning results from misalignment, brightness, or background changes.
- Ultimately, the results emphasize that you won't know the outcome until you create a dataset and train it.
- This time, each element (misalignment, brightness, background) was changed one by one to see their effects, but predicting results when multiple elements are involved (e.g., misalignment & brightness change) is difficult.
- The experience-based belief that you won't know the results until you train with data was confirmed.
Bonus: Trying AWS Lookout for Vision
#So far, we have used open-source code, but with AWS Lookout for Vision, you can easily build an anomaly detection AI by just clicking through the UI. It allows for easy anomaly detection training without engineers, so we tried it as well.
The same four types of datasets were used for training.
Lookout for Vision requires at least 10 normal and 10 abnormal images in the test dataset, so 5 normal and 5 abnormal images were added to the test dataset used for the anomaly detection model.
Training Results
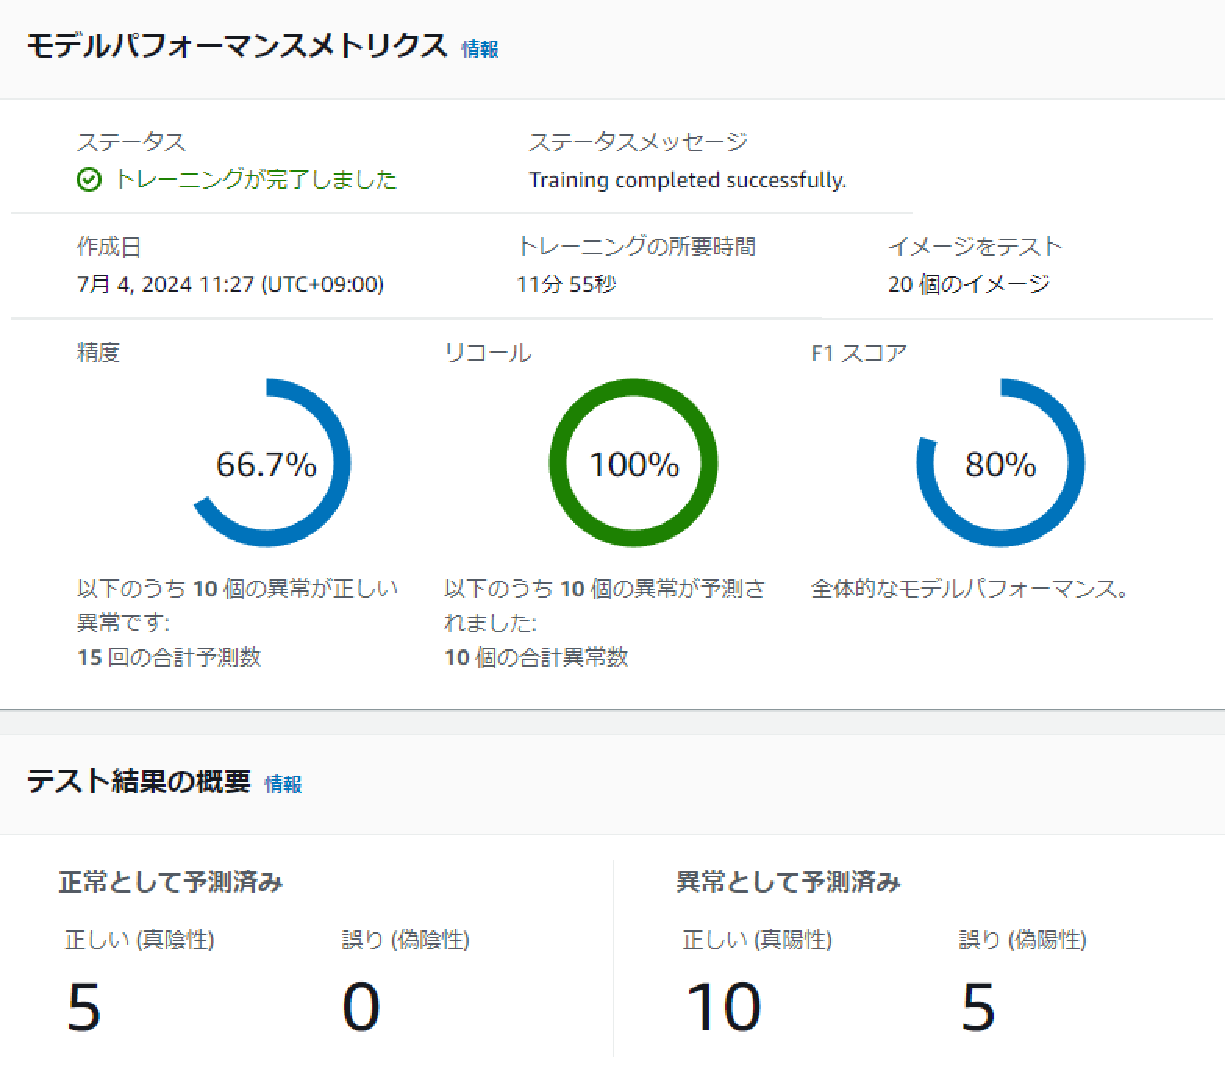
#In Lookout for Vision, accuracy, recall, and F1 score are displayed after training.
We will compare these three indicators for each of the four datasets.
- No Misalignment, Constant Brightness, Constant Background
First, the original MVTec data. Since the threshold cannot be set manually, comparing F1 scores might be best. The F1 score was 80%.
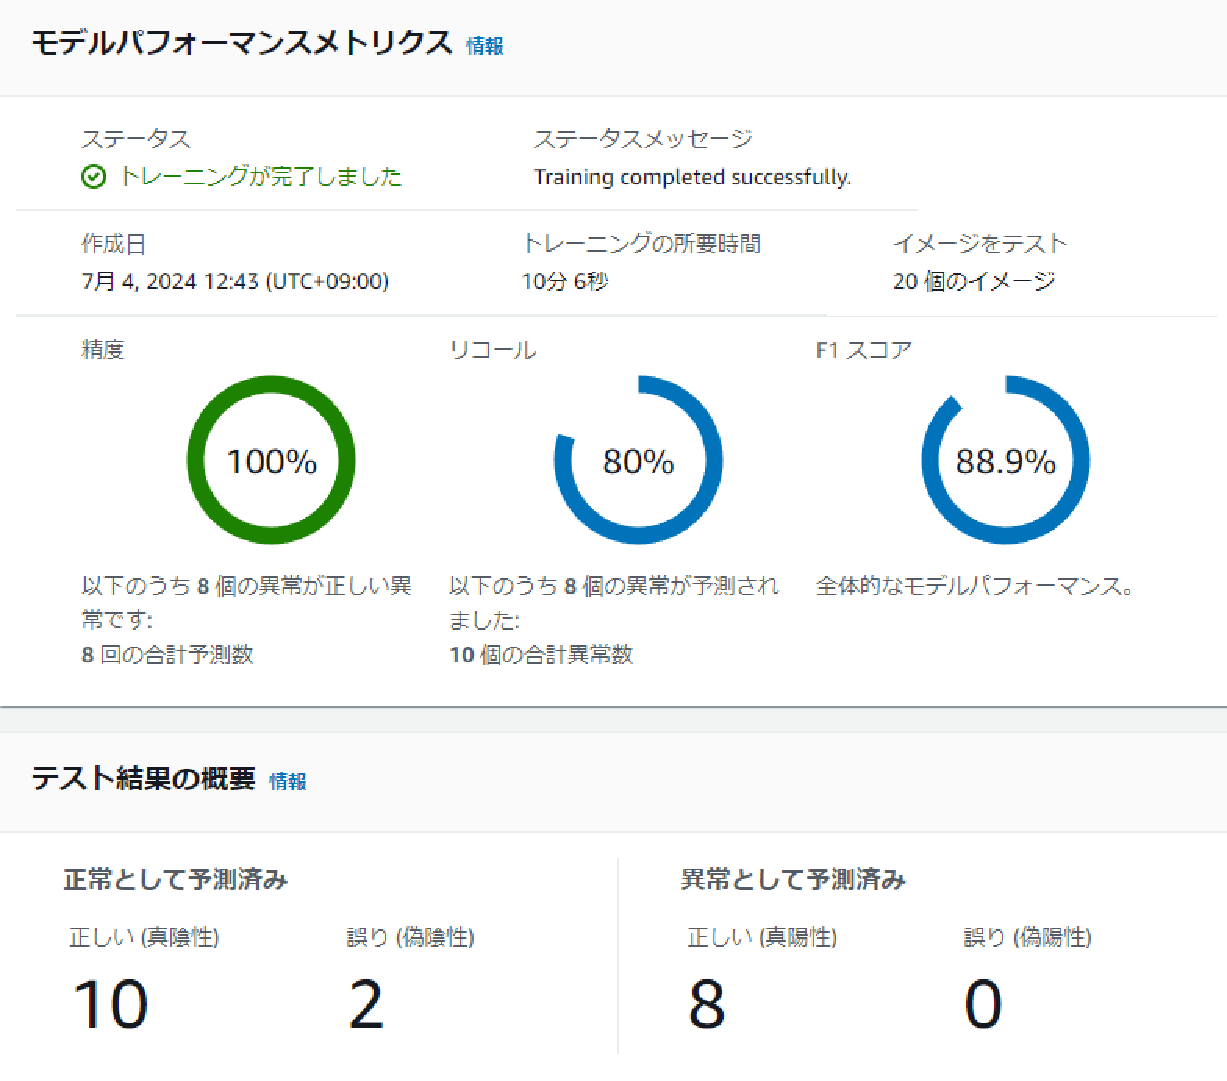
- Misalignment, Constant Brightness, Constant Background
The F1 score for misalignment data was 88.9%, better than the original data.
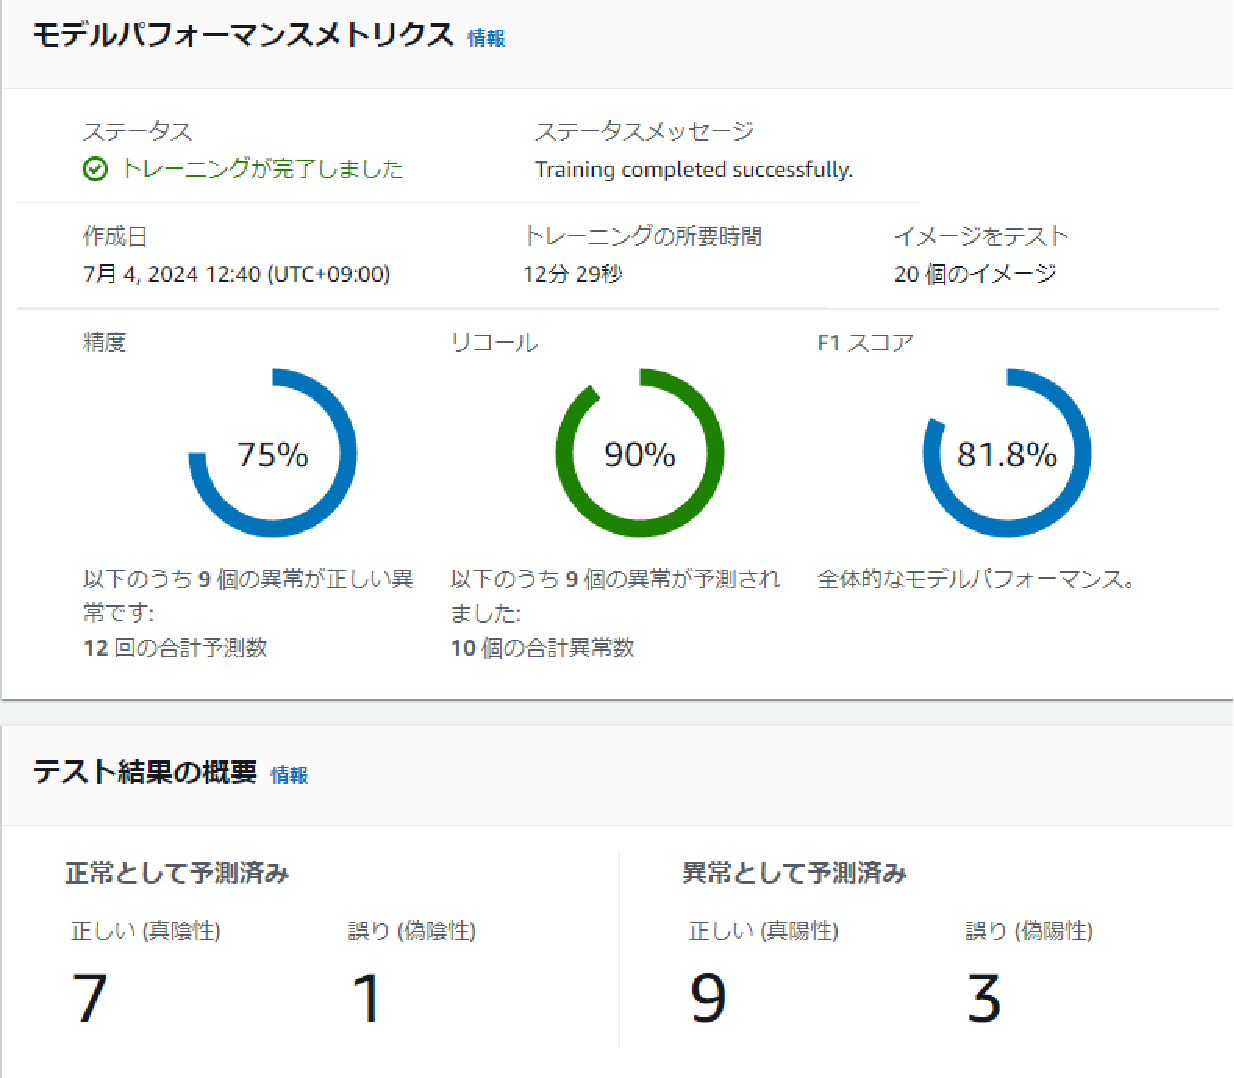
- No Misalignment, Changed Brightness, Constant Background
The F1 score for brightness-changed data was 81.8%, similar to the original data.
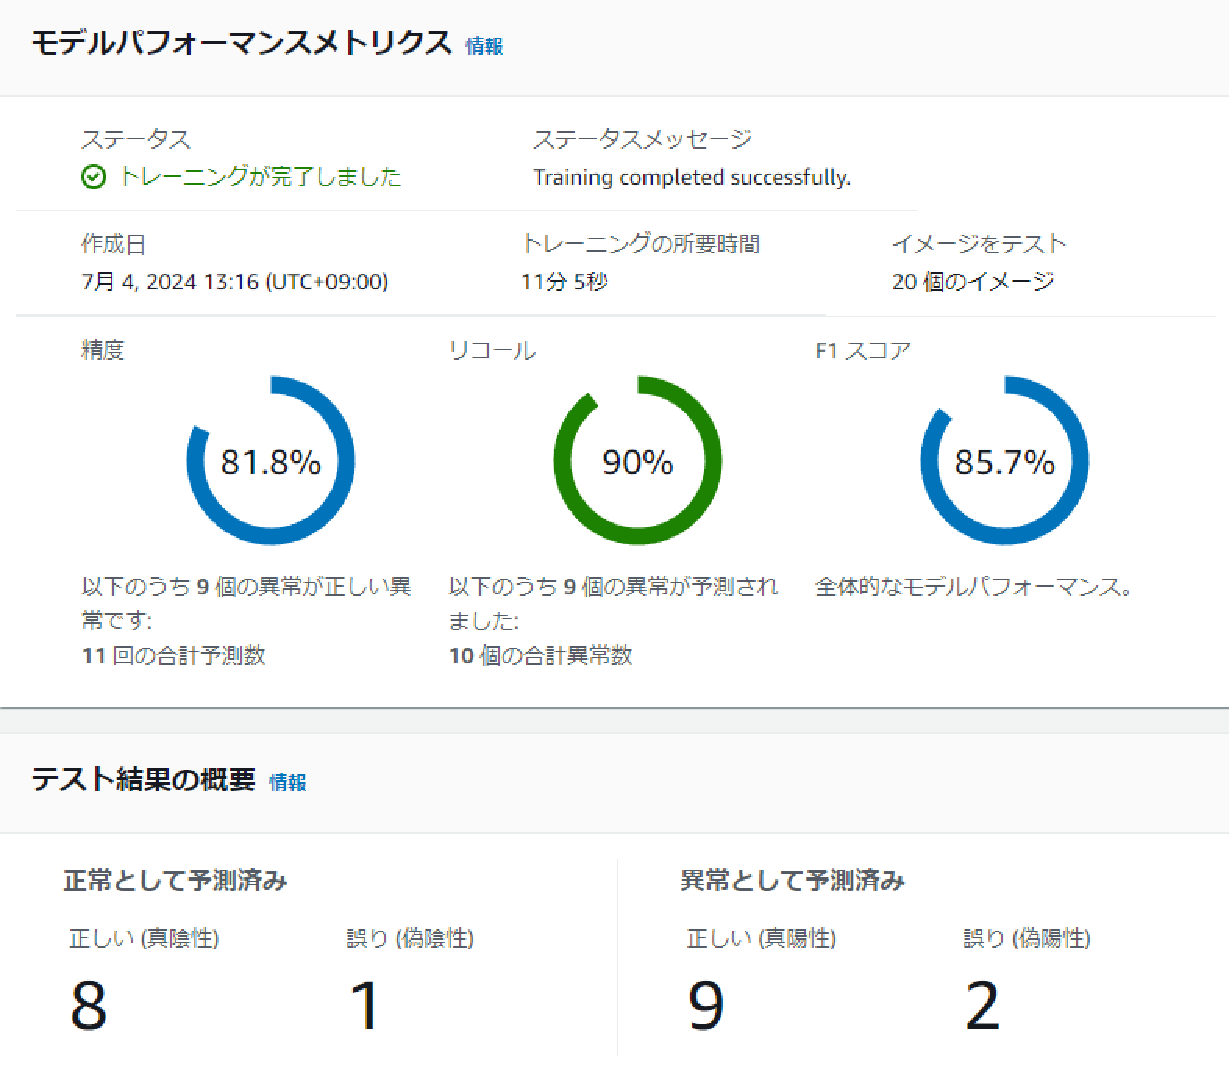
- No Misalignment, Constant Brightness, Changed Background
The F1 score for data with random squares in the background was 85.7%.
Summary of Lookout for Vision Results
#The FAQ for Lookout for Vision states:
For example, if lighting, zoom level, focus on the area of interest, and alignment are constant, you can start with as few as 30 images, but for more complex use cases with many variations (lighting, alignment, perspective), you may need hundreds of training examples and high-quality annotations.
It was predicted that the model might not be strong against misalignment and other changes.
However, in this case, misalignment, brightness change, and background change did not significantly affect accuracy.
We wanted to set the threshold to make recall=1, but we couldn't find such a feature. Also, there doesn't seem to be a feature to calculate AUC.
Pros and Cons of Lookout for Vision
#Here are the pros and cons of using Lookout for Vision.
Pros:
- Anomaly detection can be done easily without code.
- Easy deployment.
Cons:
- The threshold is set by default (not easily changeable to make recall=1?)
Regarding this, the AWS FAQ states:
Amazon Lookout for Vision can use Amazon Augmented AI (Amazon A2I) to route low-confidence predictions to human reviewers (process engineers, quality managers, or operators). You can specify the conditions for routing predictions to reviewers based on confidence score thresholds or random sampling percentages. You can adjust these thresholds to achieve the right balance of accuracy and cost-effectiveness.
It seems that threshold adjustment is possible. - No feature to calculate AUC.
Conclusion
#For anomaly detection using image AI, it is important to select an appropriate model according to the dataset. Each model, including anomaly detection, object detection, segmentation, and classification, has its own advantages and disadvantages, and it is necessary to choose according to specific use cases. Ultimately, it is essential to actually train with the data and verify the results.