Considering AI Utilization by the Scrum Master - Transparency
Back to TopTo reach a broader audience, this article has been translated from Japanese.
You can find the original version here.
Introduction
#I am Ishida from the Agile Group.
Considering AI Utilization by the Scrum Master - Introduction is the sequel. Last time, referring to the Scrum Guide Expansion Pack, we touched on enhancing "empirical process control" as one possibility for AI to strengthen Scrum.
As Scrum Masters, by leveraging AI in the Scrum process, we can further strengthen the three pillars of Scrum—transparency, inspection, and adaptation—that the team practices.
Approach to Transparency
#In this article, we focus on "transparency," the first step of the three pillars. Here, transparency does not simply mean making things visible; it means providing the materials necessary for the team to make the right decisions (inspection and adaptation).
This time, rather than asking AI to analyze the data itself, we introduce an approach of "delegating the creation (coding) of visualization tools to AI." Specifically, we will share a case where, together with AI, we implemented a process to fetch and process Jira data with Google Apps Script (GAS) and visualize it.
Why Have AI Create "Visualization Tools"
#For Scrum Masters to accurately observe the team's state and for team members to view themselves objectively, quantitative data is indispensable.
Project management tools like Jira come with standard reporting features, but in practice, there are frequent needs that standard features can't cover, such as "I want to view it from this angle a bit more" or "I want to cross-reference it with information in an external spreadsheet." Jira provides a powerful API that allows free handling of data, but for Scrum Masters who are not dedicated developers, developing a tool from scratch is a high hurdle in terms of learning cost and time.
That's why we want to leverage generative AI to write code and act as a "dedicated engineer for the Scrum Master." This removes technical barriers and dramatically increases the Scrum Master's agility.
While careful discussion is required from a maintainability perspective before using AI-generated code directly in production, when it comes to creating temporary tools or dashboards for internal team use, this is an area where actively utilizing AI can demonstrate its value.
From here, we will introduce an actual example of team visualization using generative AI performed in our operations.
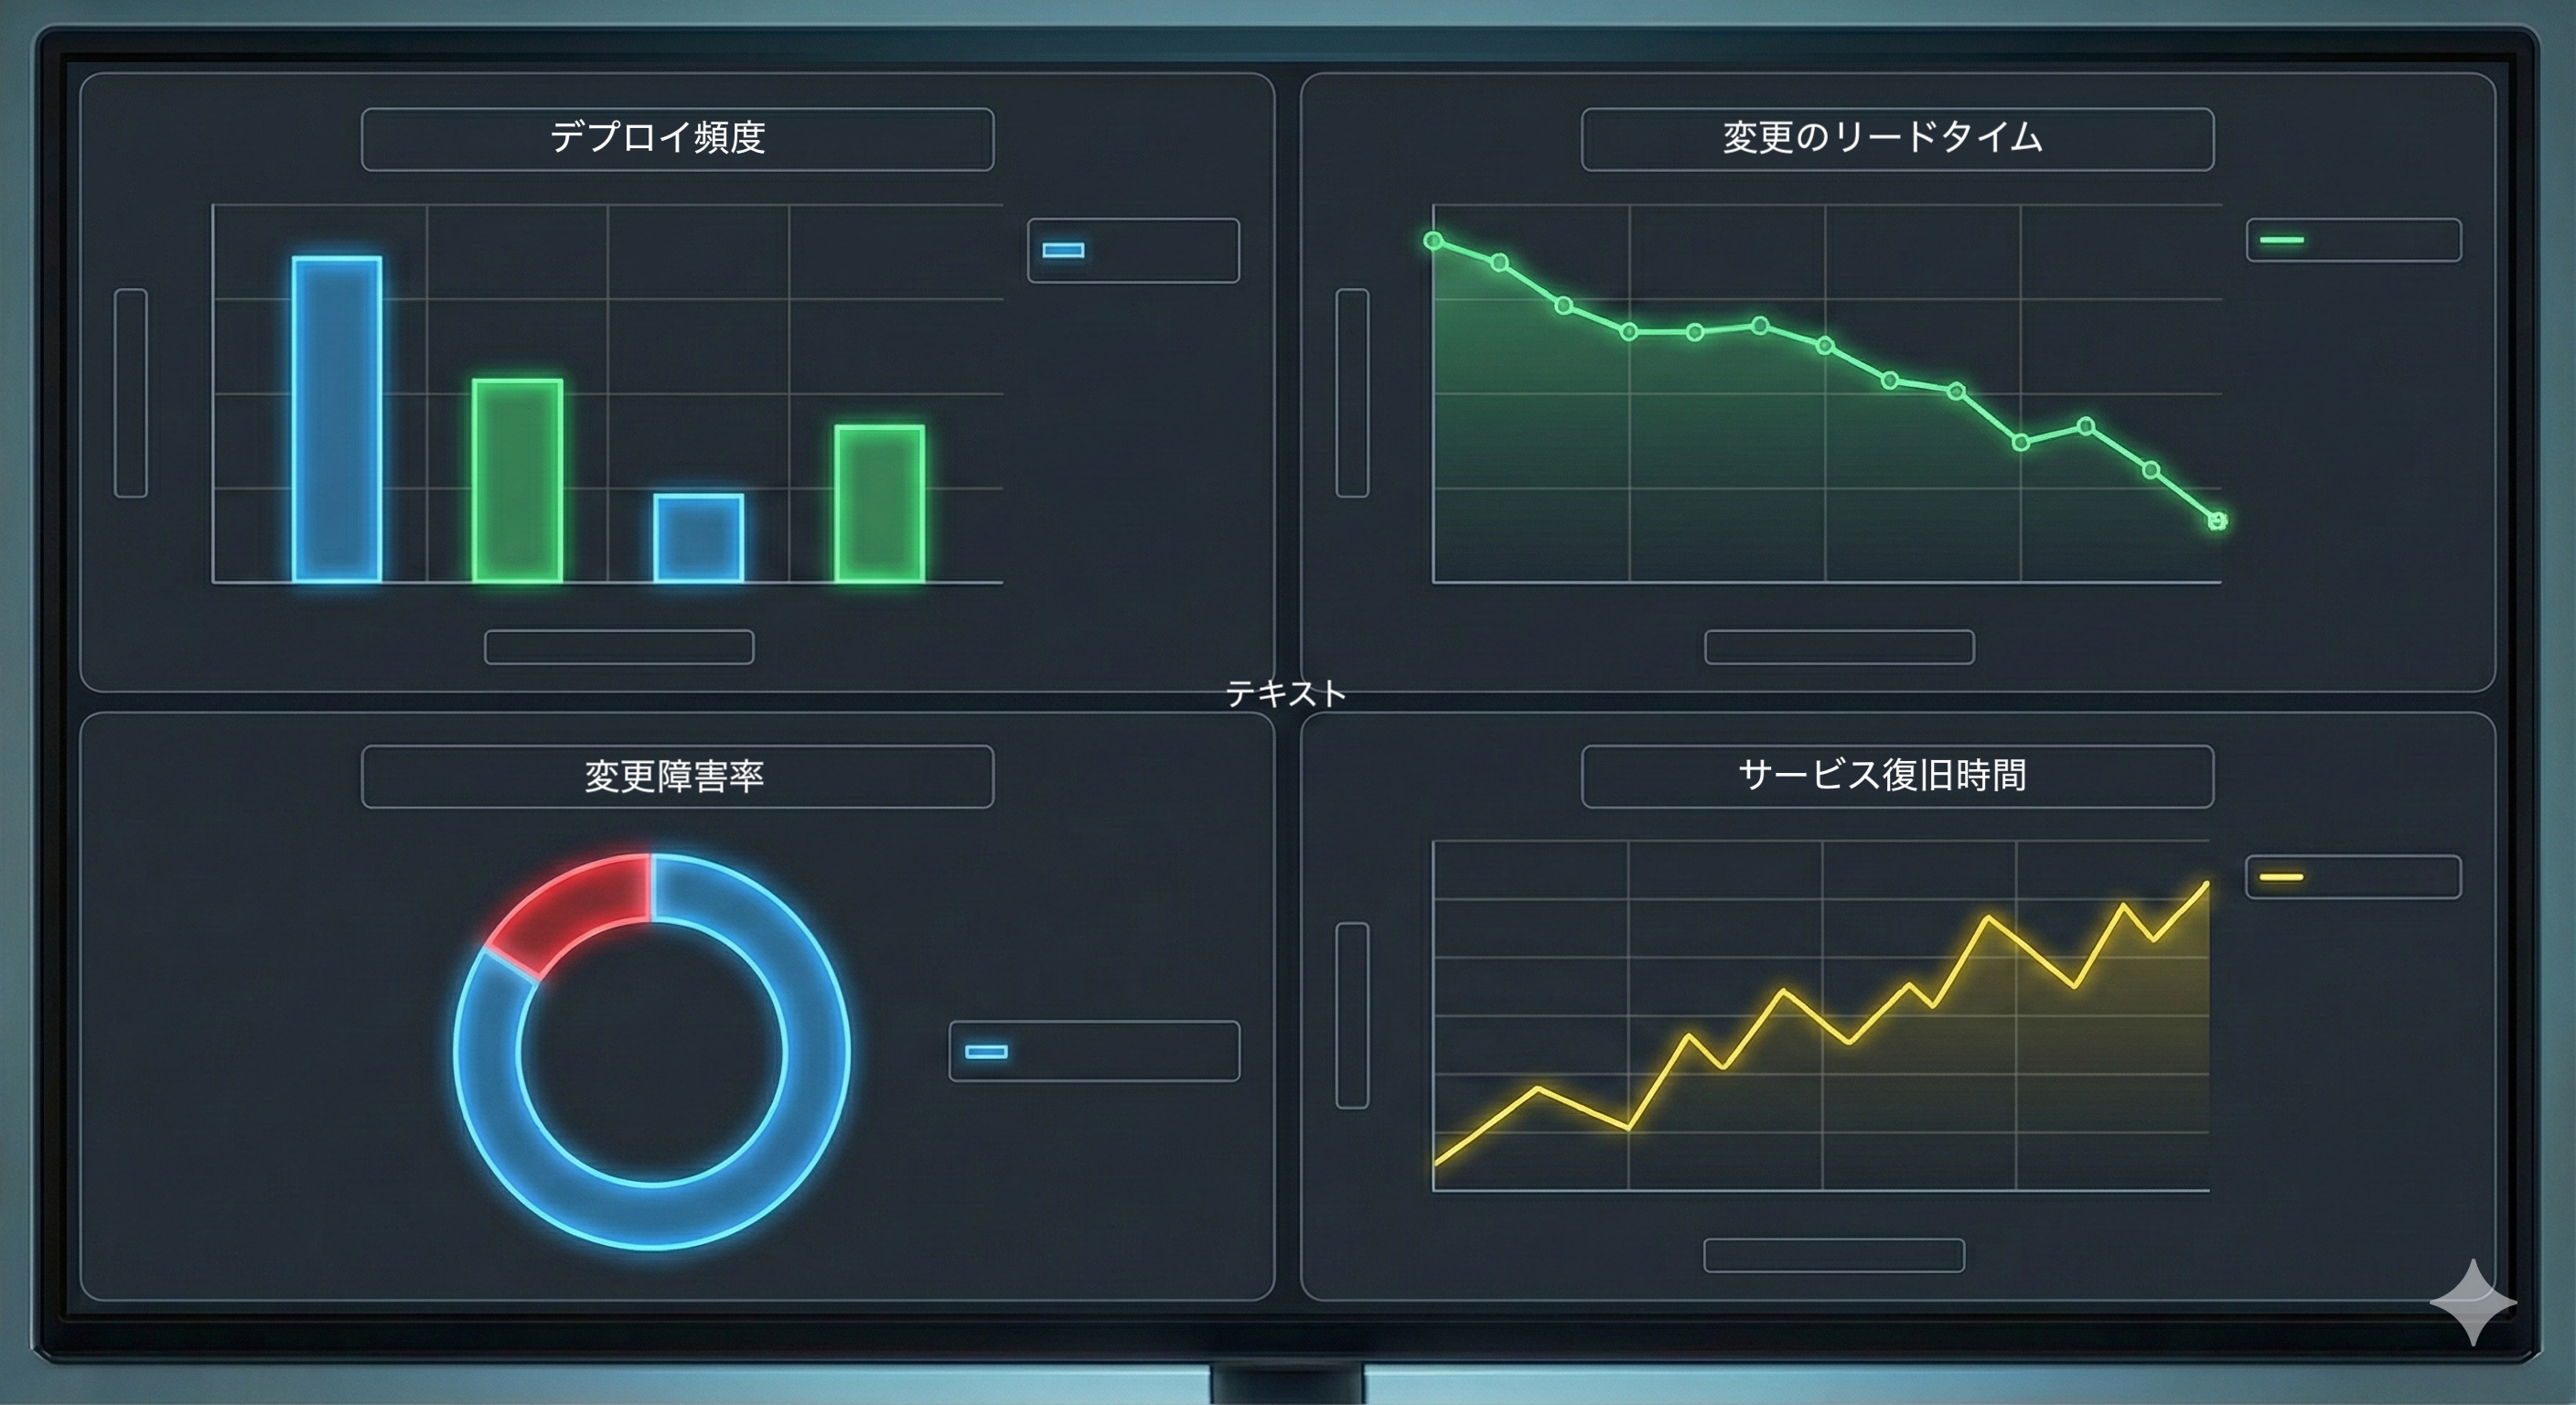
Practical Example 1: Visualizing Development Speed and Stability with Four Keys
#What is Four Keys?
#First, let's briefly touch on "Four Keys," the target of visualization this time. Four Keys are four metrics proposed by Google's DevOps Research and Assessment (DORA) team to measure the performance (delivery capability) of software development teams.
- Deployment Frequency: The frequency of releases to production.
- Lead Time for Changes: The time from when code is committed to when it is running in production.
- Change Failure Rate: The percentage of deployments that cause failures.
- Time to Restore Service: The time from a failure's occurrence to its recovery.
These metrics indicate development "speed (1 and 2)" and "stability (3 and 4)." By measuring these metrics, teams can objectively grasp whether they are delivering value quickly and stably.
The definitions of the metrics are clear, but when trying to measure them in our environment, we encountered several barriers.
First, the lead time for changes (the time from starting development to release) can be calculated from Jira's status transition history, but it is difficult to calculate using only standard report features, and requires data retrieval via the API and processing. Also, regarding the change failure rate, in this project, commercial incidents are managed in a Google Spreadsheet, so it was necessary to cross-reference that data with Jira's release information to calculate it.
To aggregate such scattered data and build a Four Keys dashboard, we adopted Google Apps Script (GAS). And as mentioned earlier, we entrusted the creation of that code to generative AI.
1. Extracting "Speed" from Jira
First, we had AI create a script to retrieve ticket data through the Jira API. The key point in the prompt was to focus on the "status transition history."
Prompt Example:
"I want to retrieve information on completed tickets from a specific Jira project. Please write a GAS function that extracts the timestamp when each ticket transitioned to 'In Progress' and the timestamp when the release containing that ticket was completed, then calculates the difference as lead time."
This enabled automatic aggregation of lead time for each ticket and the number of monthly releases (deployment frequency).
2. Calculating "Stability" from the Spreadsheet
Next, we accessed the spreadsheet used for incident management. Here, we counted the number of incidents per month and, by cross-referencing it with the previously calculated deployment count, calculated the "change failure rate."
By rendering these as a chart in a single spreadsheet, we completed a dashboard that updates the team's Four Keys daily.
By making the latest Four Keys visible to everyone on the team at any time, they could see their release frequency and the accompanying quality impact (incidents) at a glance, achieving transparency in the team's "speed" and "stability."
Practical Example 2: Visualizing "Acceleration" for Fixed-Release Projects
#The second example concerns actions slightly beyond the Scrum framework. Due to the nature of the project, there were fixed-release "must-meet" deliverables, and we were pressed for time handling them. Ideally in Scrum, scope should be adjusted based on velocity results, but in this case, the scope was fixed and we found that with our usual velocity, we couldn’t meet the release on time.
As a realistic response, we decided to temporarily increase developer capacity (headcount and hours) to accelerate the pace.
However, simply increasing capacity didn't make it intuitive from the traditional burndown chart how much development speed had increased or whether we'd truly meet the deadline at the current pace. The anxious feeling of "we’re working hard but aren’t sure if we’ll make it" lowered the team’s morale.
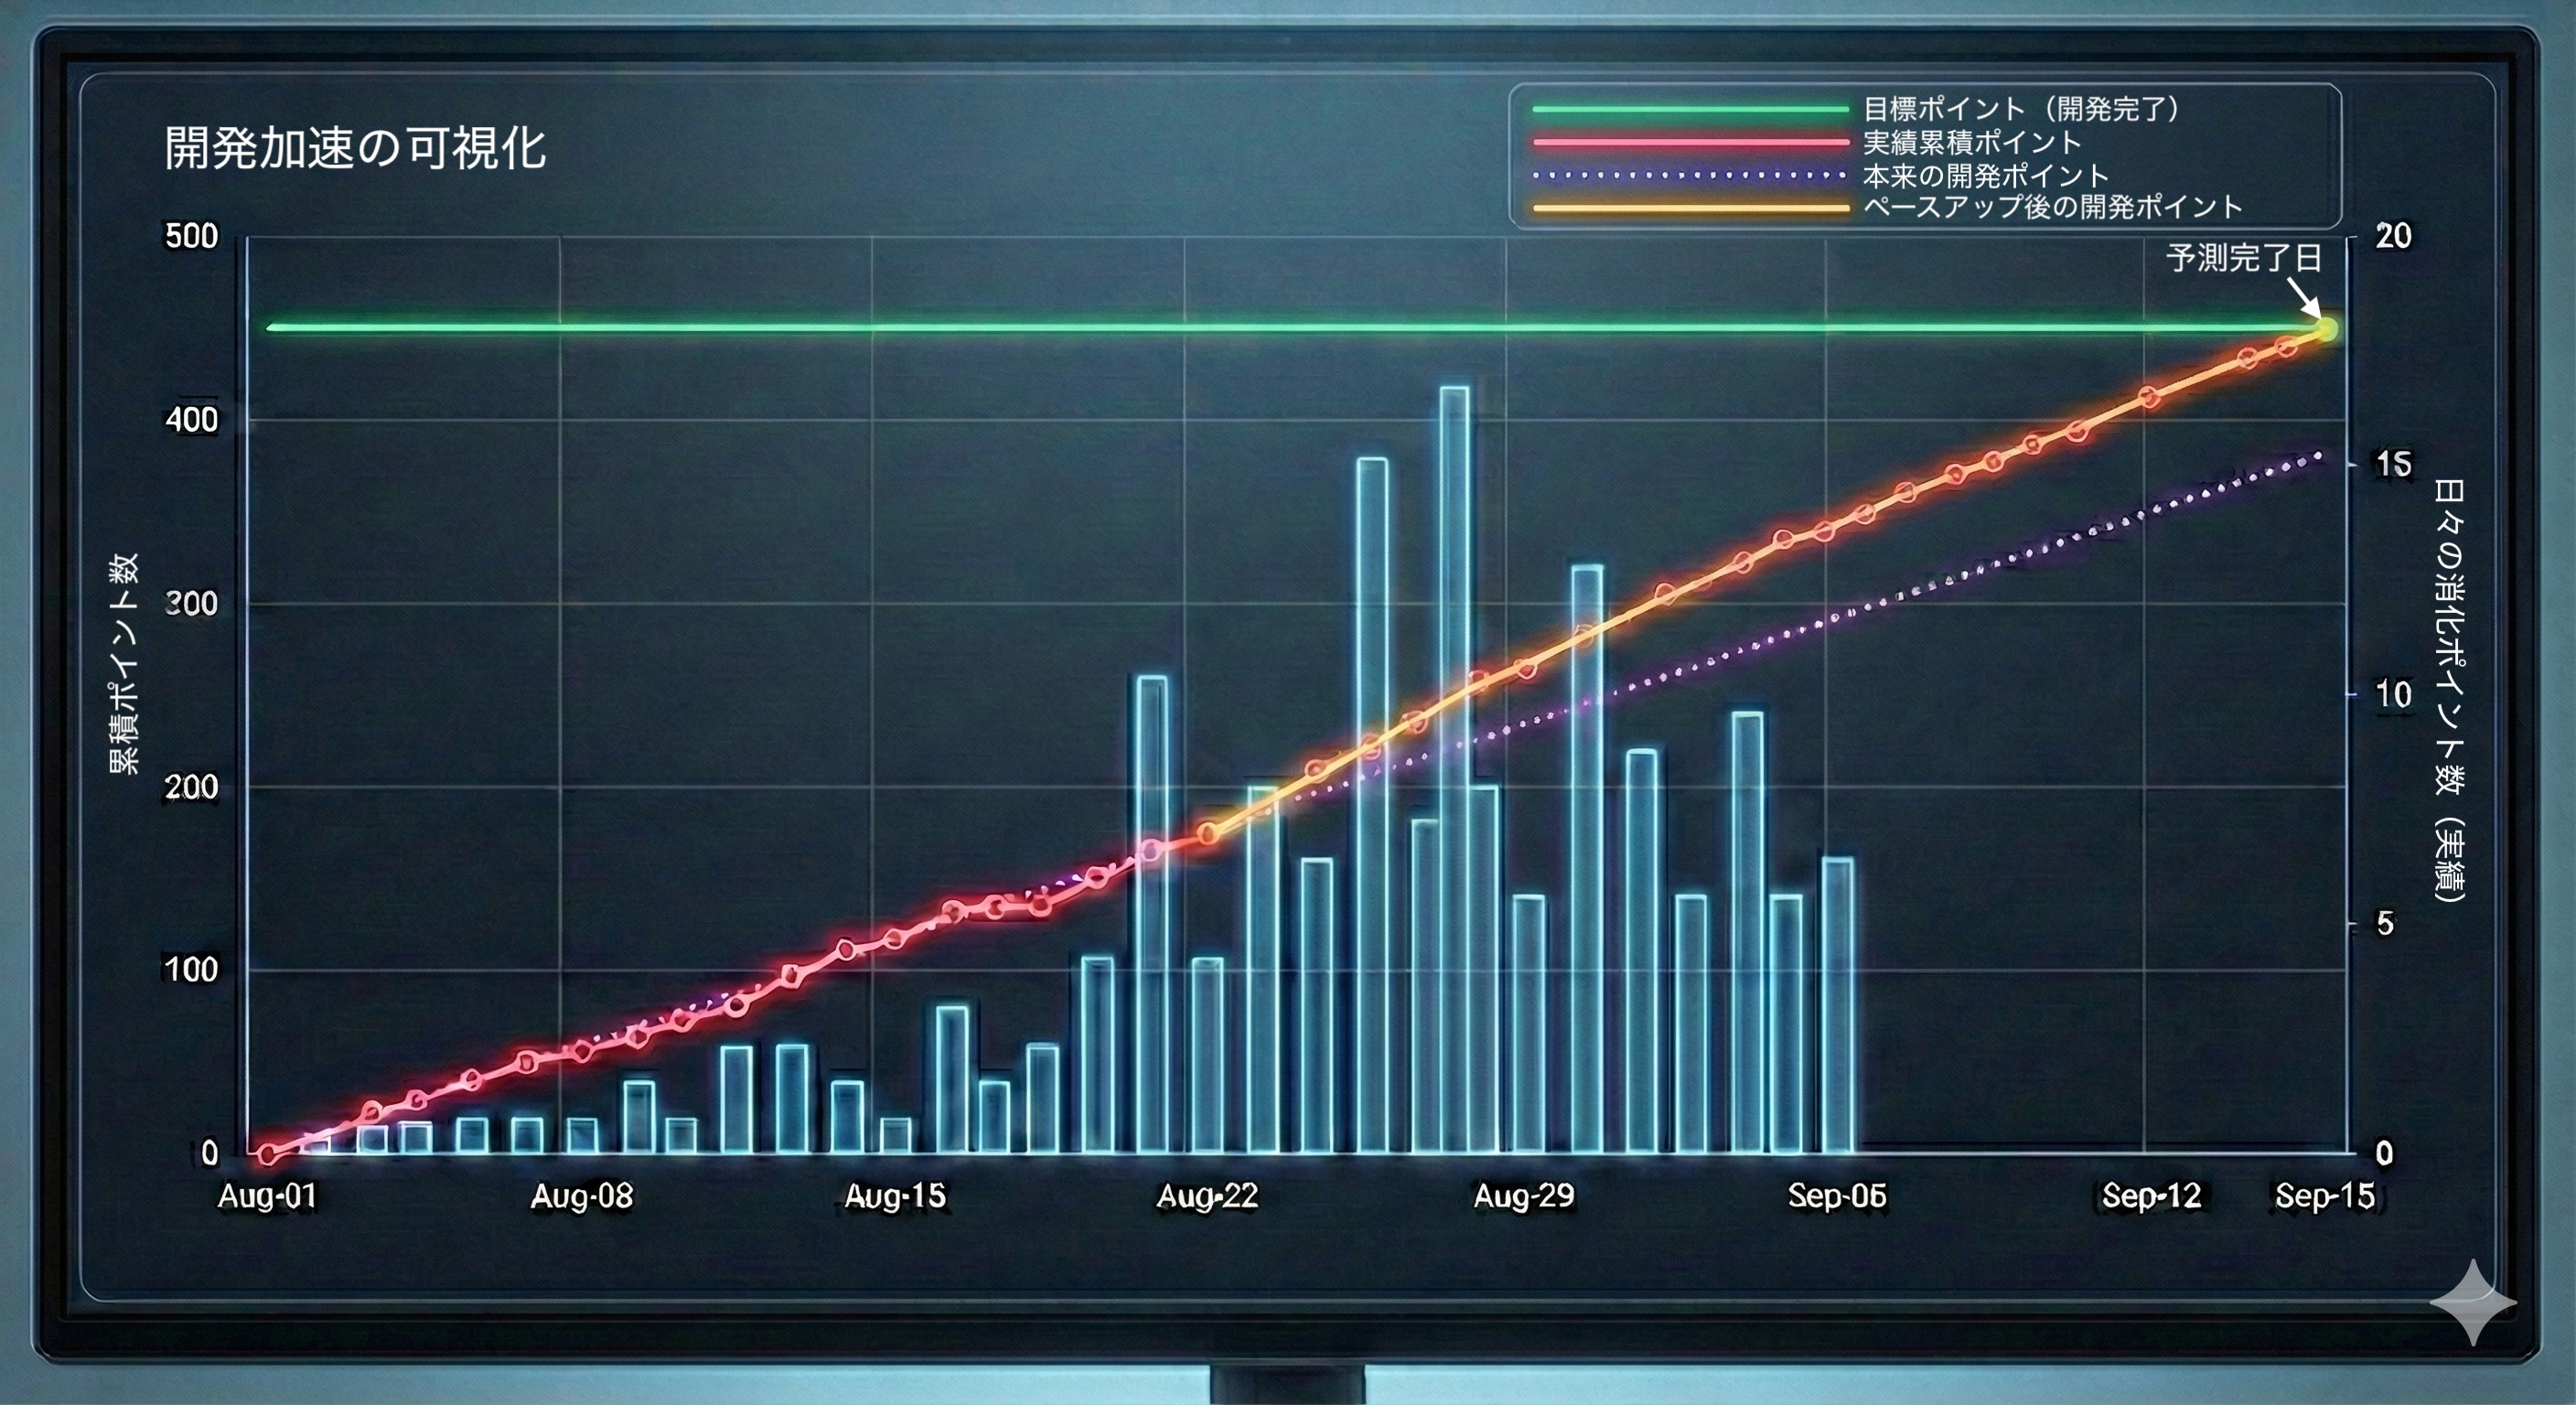
So, we used AI here as well. We had AI create a script that, based on the "daily completed points (actuals)" retrieved from the Jira API, calculates how many days are needed to complete the remaining work and plots the trend of the "predicted completion date."
This allowed us to visualize how, after increasing capacity, the graph’s slope became steeper (the throughput pace increased) and how the predicted completion date approached just before the release date (the figure below is an example). By presenting a clear outlook to the team and stakeholders, such as "At the current acceleration pace, we will finish on X date," we dispelled vague anxieties and helped development members proceed with confidence.
The "Agility" AI Brings to the Scrum Master
#Even when thinking, "It would be great to have this kind of data," we had given up on visualization due to lack of technical skills or time constraints. AI pair programming made it possible to realize it in a few hours.
Transparency is all about freshness. When you sense that a problem might occur, having the ability to immediately create a visualization tool with your own hands is a powerful weapon for Scrum Masters protecting their teams. The agility to instantly turn "invisible anxieties" into "visible issues" may be the greatest benefit of leveraging AI.
Conclusion and Preview of Next Article
#In this article, we introduced cases where, by writing GAS using AI, we unearthed data sleeping in Jira and spreadsheets and quickly and cost-effectively achieved the transparency the team needed. This is the first step toward practicing the "enhancement of empirical process control through AI" suggested in the Scrum Guide Expansion Pack.
However, transparency is not the goal. What’s important is how you make decisions and change your actions based on the visualized data. In the next third installment, "Inspection and Adaptation," we will introduce AI utilization in decision-making scenarios based on visualized information from a perspective different from transparency.