Debugging the ESP32 Development Board with ESP-PROG and Platform IO
Back to TopTo reach a broader audience, this article has been translated from Japanese.
You can find the original version here.
When programming with the convenient IoT device "ESP32 Development Board" (hereafter referred to as ESP32), I often find myself thinking, "Ah, I really want to debug this in Visual Studio Code (hereafter referred to as VSC)."
Previously, to debug programs, I would write print statements in the program to output the content I wanted to check to the COM port or to an external display like an OLED. However, it was cumbersome and tedious to add print statements every time to output internal variables for detailed checks.
This time, I would like to introduce the ESP-specific JTAG debugger "ESP-PROG (Espressif's official JTAG board)" which eliminates such tedious tasks all at once.
What is ESP-PROG?
#ESP-PROG appearance
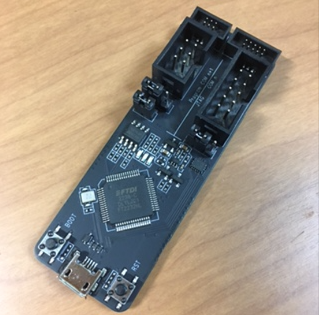
You can purchase it from Amazon or Switch Science (although I bought it from a cheaper place).
It seems to be a board equipped with "FT2232HL (Dual USB Serial)". This device has two USB serial ports available, but this time we will use only one port for debugging, and the USB port on the ESP32 itself for programming. I would like to introduce programming using the remaining USB serial port of ESP-PROG on another occasion.
The development target is the 30-pin ESP32 (ESP32 Dev Module).
(The reason for selecting this development target is that I only had a power board with 30 pins available for pulling out jumper pins. I considered using a breadboard, but for details on the usability of breadboards, please refer to another article.)
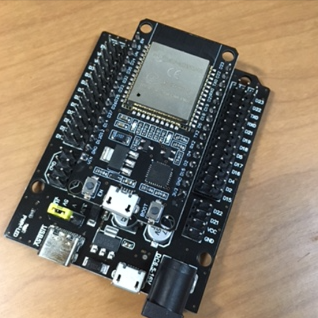
ESP32 and power board
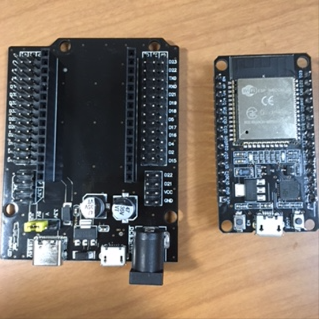
Set up by docking.
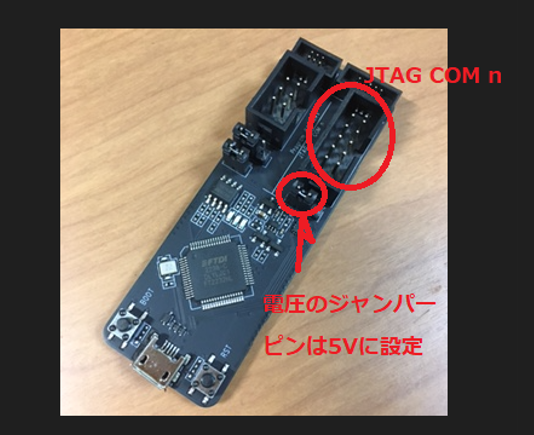
The pin configuration of ESP-PROG can be found at this URL.
For connecting to the ESP32, use the pins in the connector section labeled "JTAG COM n".
(Set the jumper pin for switching the power voltage of ESP-PROG to the "5V" side.)
Connect ESP32 and ESP-PROG as shown in the following diagram.
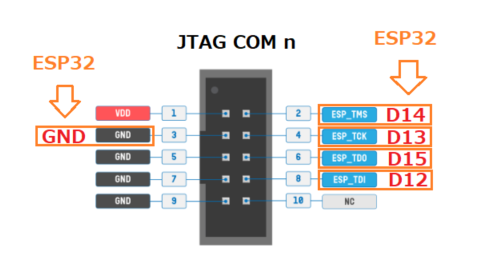
| ESP-PROG | ESP32 |
|---|---|
| ESP_TMS | GPIO14 (D14) |
| ESP_TCK | GPIO13 (D13) |
| ESP_TDO | GPIO15 (D15) |
| ESP_TDI | GPIO12 (D12) |
| GND | GND |
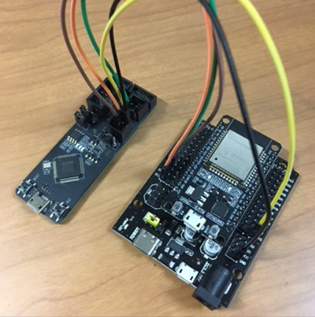
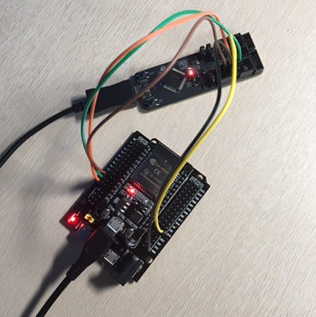
Connected state of ESP32 and ESP-PROG
(I couldn't find a cable that fits exactly into the JTAG connector of ESP-PROG... I'm connecting using ordinary jumper cables.)
Connect the micro USB of both ESP-PROG and ESP32 to the PC.
(Some types of ESP32 may have a Type-C USB connector, but it seems that micro USB types are still commonly distributed.)
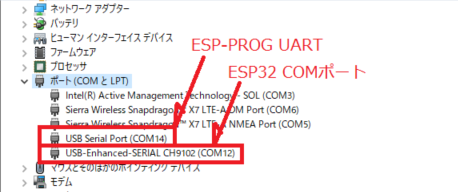
Check the COM ports in the Device Manager.
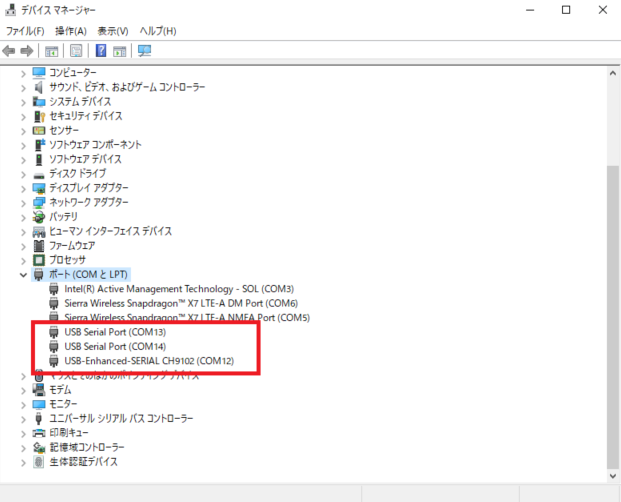
COM12, COM13, COM14 are the ones connected to ESP32 and ESP-PROG this time.
The connections of the COM ports were as follows:
- COM12: ESP32's serial port
- COM13: ESP-PROG's debug port
- COM14: ESP-PROG's UART port
※ This time, we will power and program upload from the micro USB (COM12) of ESP32, so we will not use COM14 (ESP-PROG's UART port).
Problem where ESP-PROG is not recognized as a debugger
#Here is the first major stumbling block. In fact, just having the ESP-PROG's COM port recognized as above does not allow for debugging.
Using ESP-PROG as it is will result in an error saying "Debugger not found".
(Although some articles on the internet say it can be used immediately after connecting)
To recognize ESP-PROG's debug port as a "debugger," an extra step is required.
Here, we use a tool called "Zadig".
Download Zadig from this URL.
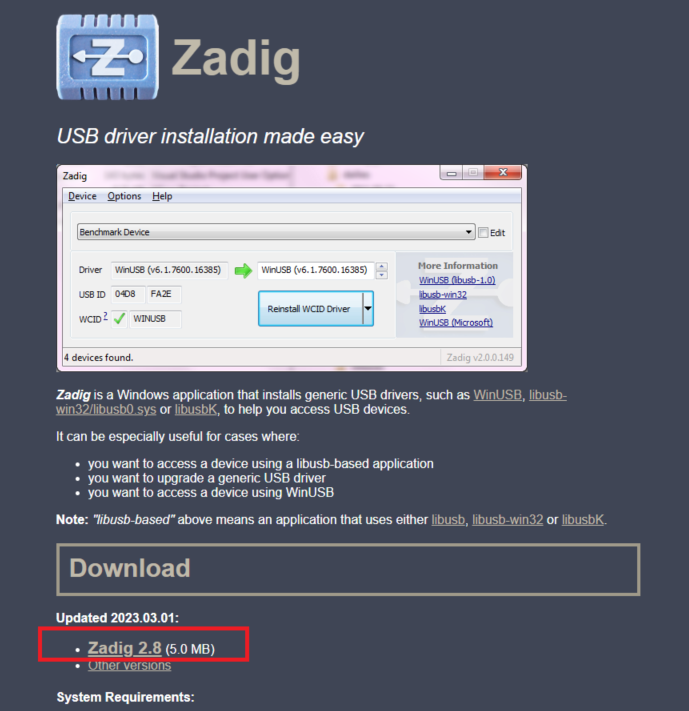
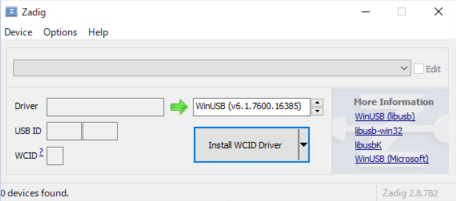
Run the downloaded "Zadig-2.8.exe" (latest as of 2024-01-02).
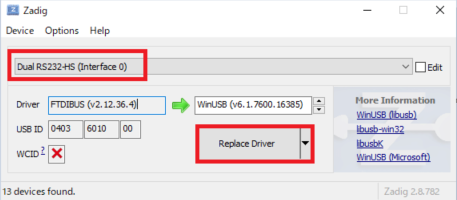
Zadig starts up.
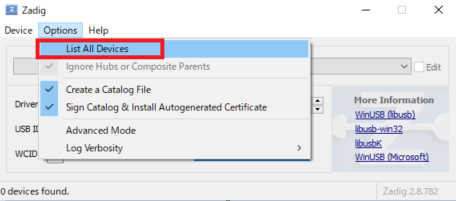
Select "List All Devices" from Options.
You should see the following two interfaces in the list:
- Dual RS232-HS (Interface 0) ← For ESP-PROG Debug
- Dual RS232-HS (Interface 1) ← For ESP-PROG UART
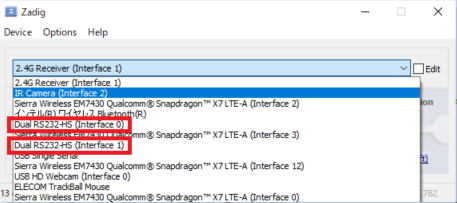
Select the "Interface 0" side of Dual RS232-HS and press the "Replace Driver" button.
(Interface 0 side is for DEBUG)
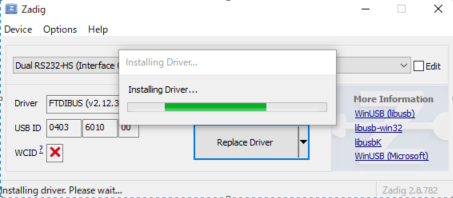
The installation begins.
After the installation is complete, check "Serial Bus Device" in the Device Manager.
If "Dual RS2332-HS" is registered under "Universal Serial Bus Devices," it's OK.
Initially, when ESP-PROG was connected via USB, the device corresponding to Interface0 was recognized as COM13, but COM13 has been deleted, and the registration has moved to the bus device side.
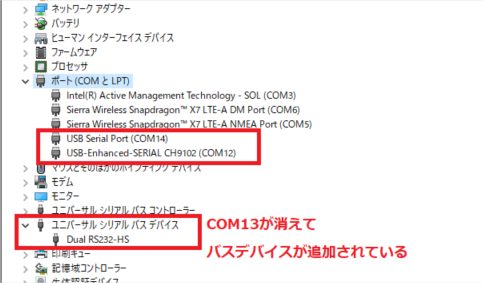
Only UART connection COM14 remains on the COM port side. (The COM12 in the image is the COM port connected to the ESP32 side.)
Creating a Sample Project with Platform IO
#As a development environment, we will use "Platform IO" (hereafter referred to as PIO), which was introduced in a previously written article "Trying IoT (Part 14: Organic LED (OLED) SSD1306 Edition)".
Now, let's create a project for ESP32.
The project created is as follows:
- Project name: ESP32_ESP-PROG
- Board: Espressif ESP32 Dev Module
- Framework: Arduino
- Location: <Do not use default!>
Here is another major stumbling block.
This time, I changed the project location to
c:/opt/ESP32_ESP-PROG/
Initially, I placed the project location at
C:/Users/<username>/OneDrive/Documents/PlatformIO/Projects
but the debugger did not properly recognize the path name containing the "Documents" folder, so I reluctantly moved it to another location.
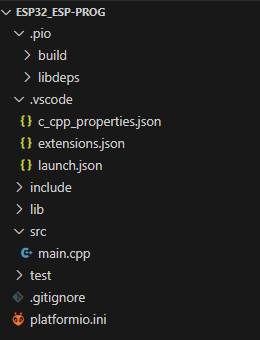
The project appearance is as follows.
As a sample program for debugging, I obtained one that handles Bluetooth from the code samples.
I only changed the part "String device_name;" to an arbitrary string.
(This time, the Bluetooth device name is set to "BT-ESP32-Slave")
#include <Arduino.h>

//This example code is in the Public Domain (or CC0 licensed, at your option.)
//By Evandro Copercini - 2018
//
//This example creates a bridge between Serial and Classical Bluetooth (SPP)
//and also demonstrate that SerialBT have the same functionalities of a normal Serial

#include "BluetoothSerial.h"

//#define USE_PIN // Uncomment this to use PIN during pairing. The pin is specified on the line below
const char *pin = "1234"; // Change this to more secure PIN.

String device_name = "BT-ESP32-Slave";

#if !defined(CONFIG_BT_ENABLED) || !defined(CONFIG_BLUEDROID_ENABLED)
#error Bluetooth is not enabled! Please run `make menuconfig` to and enable it
#endif

#if !defined(CONFIG_BT_SPP_ENABLED)
#error Serial Bluetooth not available or not enabled. It is only available for the ESP32 chip.
#endif

BluetoothSerial SerialBT;

void setup() {
  Serial.begin(115200);
  SerialBT.begin(device_name); //Bluetooth device name
  #ifdef USE_PIN
    SerialBT.setPin(pin);
    Serial.println("Using PIN");
  #endif
}

void loop() {
  if (Serial.available()) {
    SerialBT.write(Serial.read());
  }
  if (SerialBT.available()) {
    Serial.write(SerialBT.read());
  }
  delay(20);
}
Debug Settings (platformio.ini)
#For this occasion, we add some options to platformio.ini as follows.
[env:esp32dev]
platform = espressif32
board = esp32dev
framework = arduino
lib_deps = mbed-seeed/BluetoothSerial@0.0.0+sha.f56002898ee8
build_flags =
    ; Assign LED_BUILTIN to another pin
    -D LED_BUILTIN=2
monitor_speed = 115200
upload_port = COM12
upload_speed = 921600
debug_tool = esp-prog
debug_init_break = tbreak setup
;debug_init_break = tbreak loop
build_type = debug
I'll explain the details of platformio.ini.
The following three settings are basic, so there are no changes this time.
- platform: When creating a project in PIO, selecting "Espressif ESP32 Dev Module" for the board sets "espressif32".
- board: The same operation as above sets "esp32dev".
- framework: Selecting "Arduino" as the development framework sets "arduino".
The necessary library for using Bluetooth has been added.
- lib_deps: This time, since we are using Bluetooth, we have installed the "BluetoothSerial" library. (For how to set up the library, please refer to here.)
Options added for debugging with ESP-PROG are as follows.
- build_flags: Options to set during the build. The ESP32 we used this time does not have a controllable LED on the board, so we changed the pin settings. (We won't use it in this article, but just in case)
- monitor_speed: Specifies the baud rate for serial communication. (To check the results of Bluetooth communication on the COM port monitor)
- upload_port: PIO auto-detects the COM port to upload the program, but since there are two COM ports, one for ESP-PROG's UART and one for the ESP32 side, this time we explicitly specify the COM port on the ESP32 side.
- upload_speed: Specifies the upload speed.
This is probably the most crucial part of this article.
- debug_tool: Specify "esp-prog".
- debug_init_break: Specifies the function where you want to stop (break) first when executing debugging. This time, it is set to stop at the "setup" function.
- build_type: Specify "debug" for the build option. It seems that you can specify release, test, etc., other than debug.
Debug Settings (VSC)
#VSC's debug setting "launch.json" uses the default value output by PIO.
(Replace <username> with your own account)
{
    "version": "0.2.0",
    "configurations": [
        {
            "type": "platformio-debug",
            "request": "launch",
            "name": "PIO Debug",
            "executable": "c:/opt/ESP32_ESP-PROG/.pio/build/esp32dev/firmware.elf",
            "projectEnvName": "esp32dev",
            "toolchainBinDir": "C:/Users/<username>/.platformio/packages/toolchain-xtensa-esp32/bin",
            "internalConsoleOptions": "openOnSessionStart",
            "preLaunchTask": {
                "type": "PlatformIO",
                "task": "Pre-Debug"
            }
        },
        {
            "type": "platformio-debug",
            "request": "launch",
            "name": "PIO Debug (skip Pre-Debug)",
            "executable": "c:/opt/ESP32_ESP-PROG/.pio/build/esp32dev/firmware.elf",
            "projectEnvName": "esp32dev",
            "toolchainBinDir": "C:/Users/<username>/.platformio/packages/toolchain-xtensa-esp32/bin",
            "internalConsoleOptions": "openOnSessionStart"
        },
        {
            "type": "platformio-debug",
            "request": "launch",
            "name": "PIO Debug (without uploading)",
            "executable": "c:/opt/ESP32_ESP-PROG/.pio/build/esp32dev/firmware.elf",
            "projectEnvName": "esp32dev",
            "toolchainBinDir": "C:/Users/<username>/.platformio/packages/toolchain-xtensa-esp32/bin",
            "internalConsoleOptions": "openOnSessionStart",
            "loadMode": "manual"
        }
    ]
}
Build, Upload, and Debug
#Build the program with PIO and upload it to the ESP32.
Sometimes ESP32 fails to write the program, but you can write it by resetting the ESP32, etc.
Various people seem to be working on measures for problems where programs cannot be written to ESP32.
(Reference: What to try when you can't write a program to ESP32)
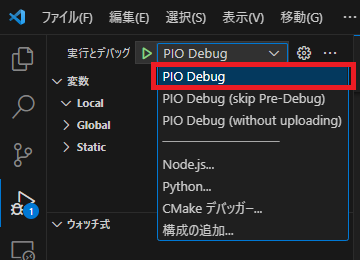
Select debug in VSC and run "PIO Debug" from "Run and Debug".
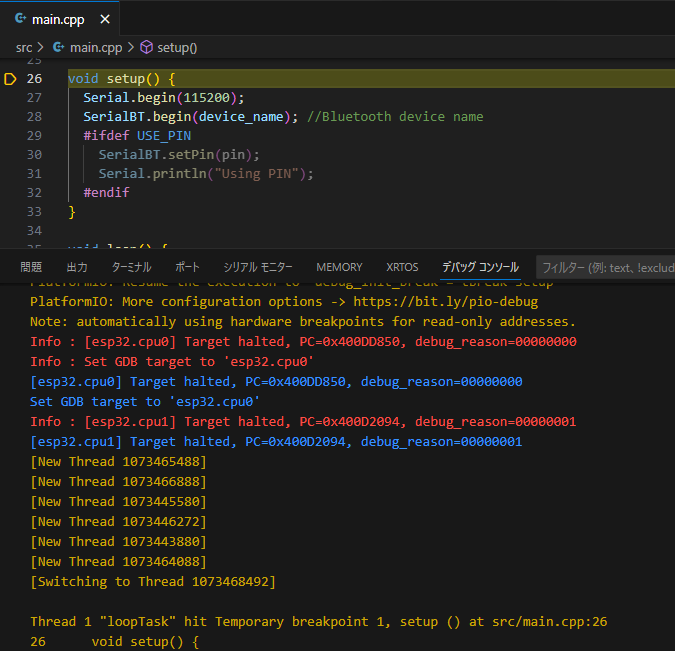
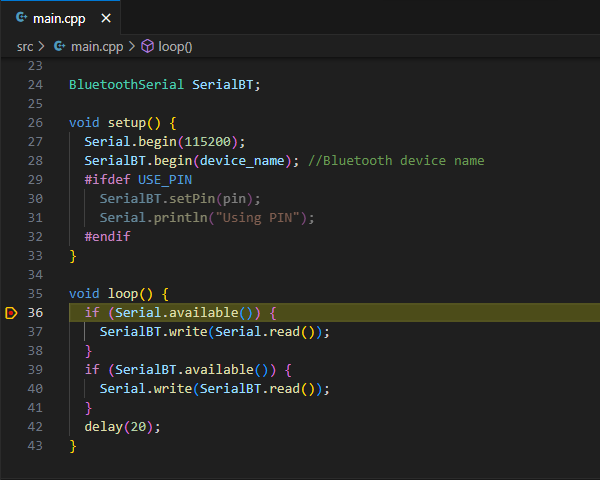
The debugger is activated and stops at the "Setup function".
(Because it is specified in the INI file's "debug_init_break" option)
You can see on the "Debug Console" at the bottom right of the screen that it is stopped at line 26, "void setup()".
If you continue running, it will stop at the set breakpoint.
"This is debugging!" It's definitely more efficient than debugging with print statements.
Step execution is also possible.
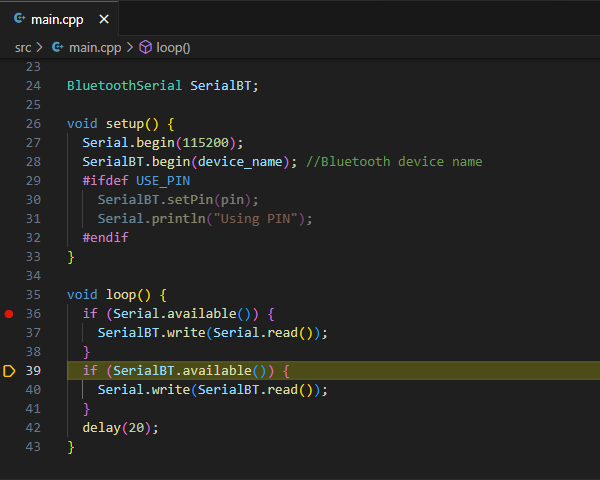
It has become possible to check detailed parts such as what kind of operation it performs when connected via Bluetooth.
A Little "Mystery"
#Let's make a slight change to the program.
Set up a global variable "counter" and a local variable "_counter" in the program, and simply increment them in the loop function.
Excerpt from the program
// Definition of global variables
int counter = 0;

void setup() {
  Serial.begin(115200);
  SerialBT.begin(device_name); //Bluetooth device name
  #ifdef USE_PIN
    SerialBT.setPin(pin);
    Serial.println("Using PIN");
  #endif
}

void loop() {
  // Definition of local variables
  int _counter = 0;

  // Operation on global variables
  counter++;
  // Operation on local variables
  _counter++;

  if (Serial.available()) {
    SerialBT.write(Serial.read());
  }
  if (SerialBT.available()) {
    Serial.write(SerialBT.read());
  }
  delay(100);
}
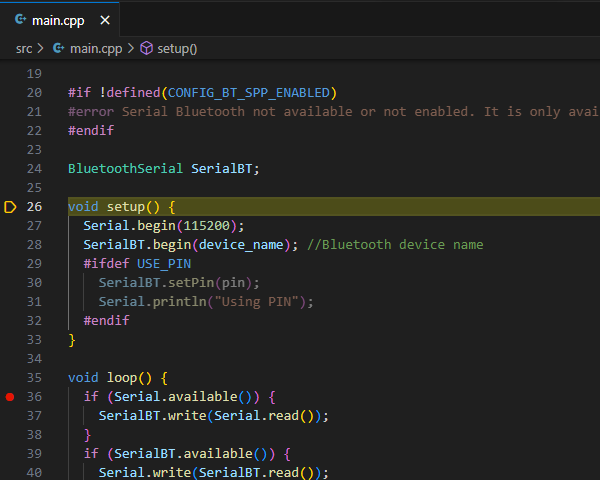
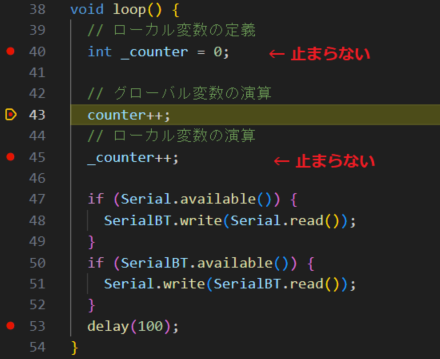
I set breakpoints on the increment parts of counter and _counter in the loop function.
The breakpoint set on the global variable worked.
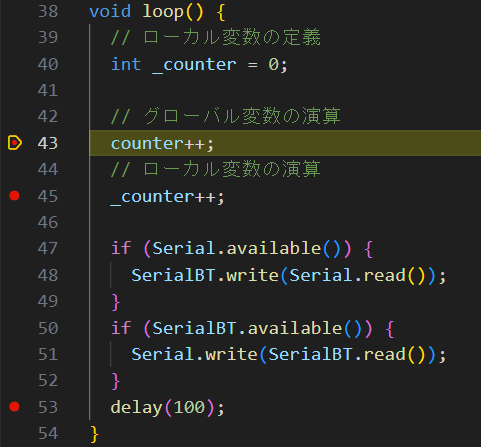
What? The breakpoint set on the local variable was skipped, and for some reason, it jumped to the next IF statement.
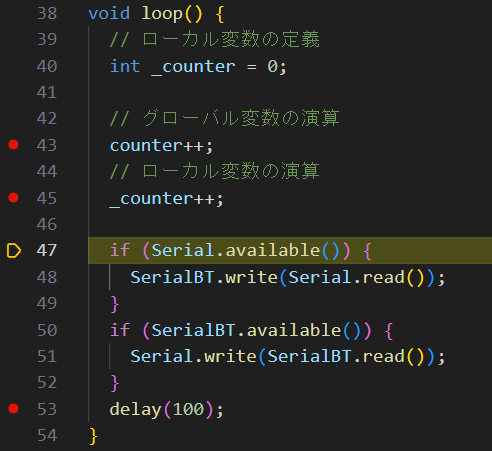
Even if I try to step through step by step, it just won't stop at the local variable part (neither the declaration nor the operation part).
I suspect that the variable was optimized and not assigned an address (this level of program might be processed on the register).
I thought it was related to the optimization option, so I checked the debug build options.
In the PIO INI file, the following settings seem to be the default.
debug_build_flags = -Og -g2 -ggdb2
However, changing the optimization option resulted in errors such as,link errors with the Bluetooth library, and the build was not successful.
Further investigation is needed in this area.
I will introduce more details in another article once I find out more.
Conclusion
#In this session, we were able to debug the ESP32 program using ESP-PROG from VSC.
It is significantly more efficient than debugging with print statements.
Well, in the case of the author, there is another question: "Am I writing programs that are so complex that I can't debug without a debugger?"